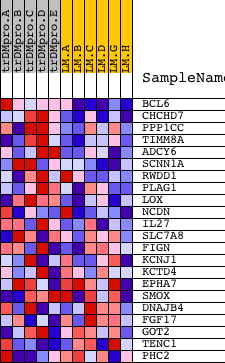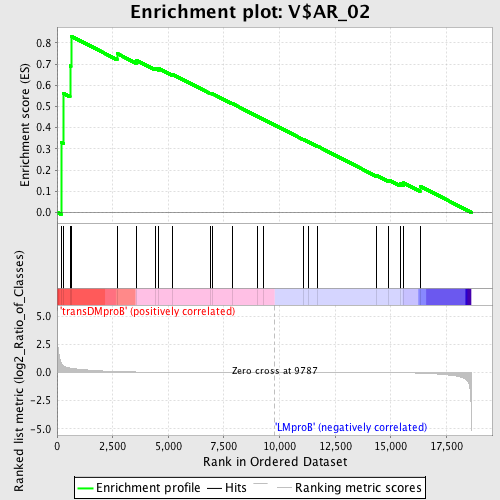
Profile of the Running ES Score & Positions of GeneSet Members on the Rank Ordered List
| Dataset | Set_04_transDMproB_versus_LMproB.phenotype_transDMproB_versus_LMproB.cls #transDMproB_versus_LMproB |
| Phenotype | phenotype_transDMproB_versus_LMproB.cls#transDMproB_versus_LMproB |
| Upregulated in class | transDMproB |
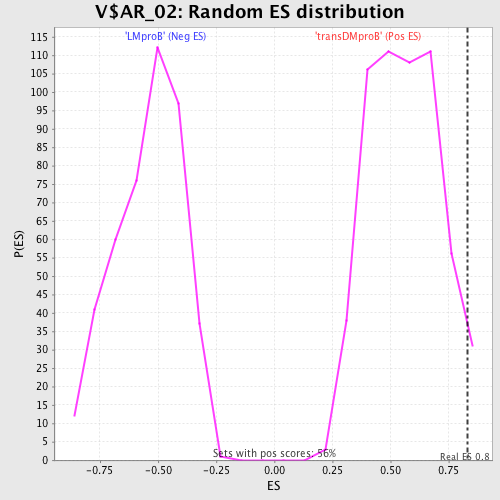
| GeneSet | V$AR_02 |
| Enrichment Score (ES) | 0.831842 |
| Normalized Enrichment Score (NES) | 1.4856439 |
| Nominal p-value | 0.028368793 |
| FDR q-value | 0.50579786 |
| FWER p-Value | 0.987 |
| PROBE | DESCRIPTION (from dataset) | GENE SYMBOL | GENE_TITLE | RANK IN GENE LIST | RANK METRIC SCORE | RUNNING ES | CORE ENRICHMENT | |
|---|---|---|---|---|---|---|---|---|
| 1 | BCL6 | 22624 | 181 | 0.872 | 0.3310 | Yes | ||
| 2 | CHCHD7 | 16280 | 280 | 0.603 | 0.5616 | Yes | ||
| 3 | PPP1CC | 9609 5283 | 581 | 0.376 | 0.6923 | Yes | ||
| 4 | TIMM8A | 24062 | 625 | 0.363 | 0.8318 | Yes | ||
| 5 | ADCY6 | 22139 2283 8551 | 2696 | 0.075 | 0.7498 | No | ||
| 6 | SCNN1A | 17278 | 3577 | 0.037 | 0.7170 | No | ||
| 7 | RWDD1 | 7306 | 4415 | 0.021 | 0.6801 | No | ||
| 8 | PLAG1 | 7148 15949 12161 | 4576 | 0.019 | 0.6790 | No | ||
| 9 | LOX | 23438 | 5182 | 0.014 | 0.6518 | No | ||
| 10 | NCDN | 15756 2487 6471 | 6897 | 0.006 | 0.5621 | No | ||
| 11 | IL27 | 17636 | 6962 | 0.006 | 0.5611 | No | ||
| 12 | SLC7A8 | 3611 21833 | 7871 | 0.004 | 0.5137 | No | ||
| 13 | FIGN | 14575 | 8985 | 0.002 | 0.4545 | No | ||
| 14 | KCNJ1 | 3121 12110 | 9274 | 0.001 | 0.4394 | No | ||
| 15 | KCTD4 | 21956 | 11065 | -0.002 | 0.3441 | No | ||
| 16 | EPHA7 | 8909 4674 | 11298 | -0.003 | 0.3327 | No | ||
| 17 | SMOX | 10455 2940 2737 2952 | 11691 | -0.004 | 0.3131 | No | ||
| 18 | DNAJB4 | 12451 1916 1832 | 14358 | -0.013 | 0.1749 | No | ||
| 19 | FGF17 | 21757 | 14914 | -0.018 | 0.1523 | No | ||
| 20 | GOT2 | 4792 3901 | 15418 | -0.026 | 0.1356 | No | ||
| 21 | TENC1 | 22349 9927 | 15563 | -0.030 | 0.1395 | No | ||
| 22 | PHC2 | 16075 | 16315 | -0.063 | 0.1237 | No |