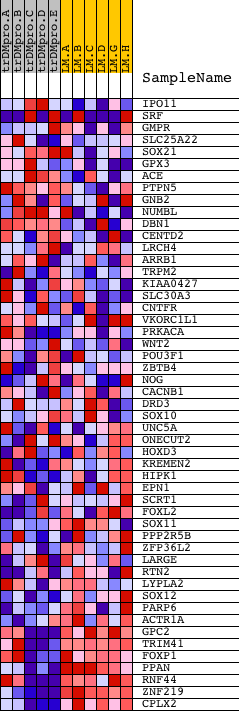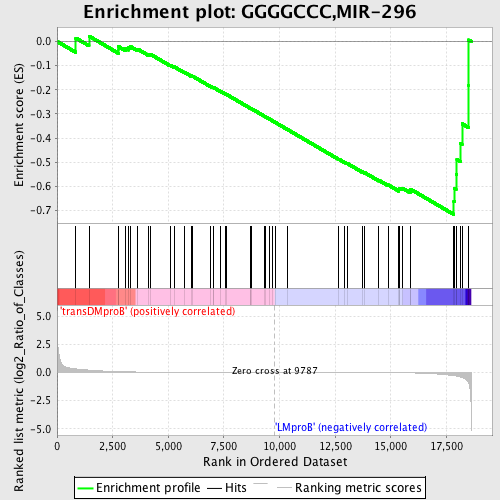
Profile of the Running ES Score & Positions of GeneSet Members on the Rank Ordered List
| Dataset | Set_04_transDMproB_versus_LMproB.phenotype_transDMproB_versus_LMproB.cls #transDMproB_versus_LMproB |
| Phenotype | phenotype_transDMproB_versus_LMproB.cls#transDMproB_versus_LMproB |
| Upregulated in class | LMproB |
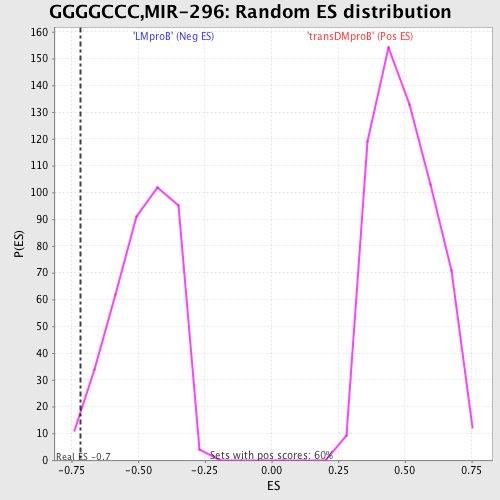
| GeneSet | GGGGCCC,MIR-296 |
| Enrichment Score (ES) | -0.7166137 |
| Normalized Enrichment Score (NES) | -1.504798 |
| Nominal p-value | 0.01754386 |
| FDR q-value | 0.5289929 |
| FWER p-Value | 0.921 |
| PROBE | DESCRIPTION (from dataset) | GENE SYMBOL | GENE_TITLE | RANK IN GENE LIST | RANK METRIC SCORE | RUNNING ES | CORE ENRICHMENT | |
|---|---|---|---|---|---|---|---|---|
| 1 | IPO11 | 21353 | 843 | 0.307 | 0.0139 | No | ||
| 2 | SRF | 22961 1597 | 1434 | 0.207 | 0.0221 | No | ||
| 3 | GMPR | 21651 | 2750 | 0.072 | -0.0348 | No | ||
| 4 | SLC25A22 | 12671 | 2753 | 0.072 | -0.0210 | No | ||
| 5 | SOX21 | 27 10278 2778 | 3078 | 0.054 | -0.0279 | No | ||
| 6 | GPX3 | 20880 | 3221 | 0.049 | -0.0261 | No | ||
| 7 | ACE | 1419 4313 | 3300 | 0.046 | -0.0215 | No | ||
| 8 | PTPN5 | 17817 | 3616 | 0.036 | -0.0316 | No | ||
| 9 | GNB2 | 9026 | 4128 | 0.025 | -0.0543 | No | ||
| 10 | NUMBL | 1663 9496 | 4179 | 0.024 | -0.0523 | No | ||
| 11 | DBN1 | 21452 | 5074 | 0.015 | -0.0976 | No | ||
| 12 | CENTD2 | 1758 18169 2284 | 5261 | 0.013 | -0.1050 | No | ||
| 13 | LRCH4 | 10544 6090 | 5710 | 0.011 | -0.1271 | No | ||
| 14 | ARRB1 | 3890 8465 18178 4276 | 6025 | 0.009 | -0.1422 | No | ||
| 15 | TRPM2 | 19717 | 6102 | 0.009 | -0.1445 | No | ||
| 16 | KIAA0427 | 11228 | 6907 | 0.006 | -0.1866 | No | ||
| 17 | SLC30A3 | 5995 | 7024 | 0.006 | -0.1917 | No | ||
| 18 | CNTFR | 2515 15906 | 7043 | 0.006 | -0.1915 | No | ||
| 19 | VKORC1L1 | 102 7625 | 7338 | 0.005 | -0.2064 | No | ||
| 20 | PRKACA | 18549 3844 | 7561 | 0.005 | -0.2174 | No | ||
| 21 | WNT2 | 17212 | 7606 | 0.004 | -0.2190 | No | ||
| 22 | POU3F1 | 16093 | 8678 | 0.002 | -0.2763 | No | ||
| 23 | ZBTB4 | 13267 | 8684 | 0.002 | -0.2761 | No | ||
| 24 | NOG | 13663 | 8755 | 0.002 | -0.2795 | No | ||
| 25 | CACNB1 | 1443 1304 | 9321 | 0.001 | -0.3098 | No | ||
| 26 | DRD3 | 22750 | 9365 | 0.001 | -0.3119 | No | ||
| 27 | SOX10 | 22211 | 9555 | 0.000 | -0.3220 | No | ||
| 28 | UNC5A | 3288 21631 | 9673 | 0.000 | -0.3283 | No | ||
| 29 | ONECUT2 | 10346 | 9795 | -0.000 | -0.3348 | No | ||
| 30 | HOXD3 | 9115 | 10345 | -0.001 | -0.3641 | No | ||
| 31 | KREMEN2 | 23104 | 12659 | -0.006 | -0.4876 | No | ||
| 32 | HIPK1 | 4851 | 12913 | -0.007 | -0.4999 | No | ||
| 33 | EPN1 | 18401 | 13039 | -0.007 | -0.5052 | No | ||
| 34 | SCRT1 | 9303 | 13716 | -0.010 | -0.5397 | No | ||
| 35 | FOXL2 | 19345 | 13828 | -0.010 | -0.5436 | No | ||
| 36 | SOX11 | 5477 | 14467 | -0.014 | -0.5753 | No | ||
| 37 | PPP2R5B | 23994 | 14883 | -0.018 | -0.5942 | No | ||
| 38 | ZFP36L2 | 8662 | 15361 | -0.025 | -0.6150 | No | ||
| 39 | LARGE | 18837 | 15367 | -0.026 | -0.6103 | No | ||
| 40 | RTN2 | 9764 | 15410 | -0.026 | -0.6075 | No | ||
| 41 | LYPLA2 | 15708 | 15536 | -0.029 | -0.6086 | No | ||
| 42 | SOX12 | 5478 | 15876 | -0.040 | -0.6191 | No | ||
| 43 | PARP6 | 19419 2979 3156 | 15887 | -0.041 | -0.6118 | No | ||
| 44 | ACTR1A | 23653 | 17834 | -0.281 | -0.6623 | Yes | ||
| 45 | GPC2 | 16321 | 17851 | -0.287 | -0.6078 | Yes | ||
| 46 | TRIM41 | 1251 20483 | 17933 | -0.317 | -0.5508 | Yes | ||
| 47 | FOXP1 | 4242 | 17971 | -0.329 | -0.4892 | Yes | ||
| 48 | PPAN | 19546 | 18119 | -0.389 | -0.4219 | Yes | ||
| 49 | RNF44 | 8364 | 18204 | -0.441 | -0.3411 | Yes | ||
| 50 | ZNF219 | 12835 | 18495 | -0.912 | -0.1805 | Yes | ||
| 51 | CPLX2 | 8779 | 18503 | -0.968 | 0.0061 | Yes |