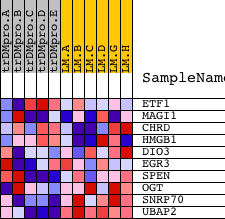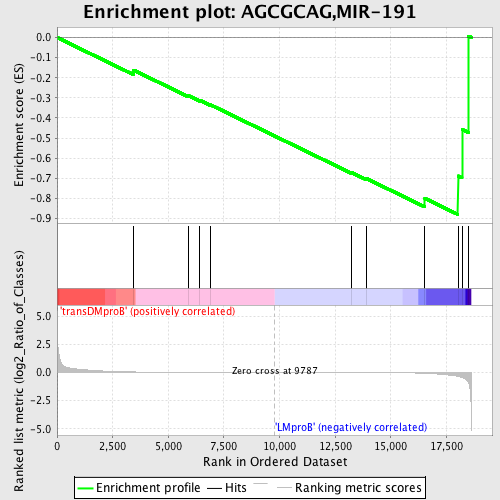
Profile of the Running ES Score & Positions of GeneSet Members on the Rank Ordered List
| Dataset | Set_04_transDMproB_versus_LMproB.phenotype_transDMproB_versus_LMproB.cls #transDMproB_versus_LMproB |
| Phenotype | phenotype_transDMproB_versus_LMproB.cls#transDMproB_versus_LMproB |
| Upregulated in class | LMproB |
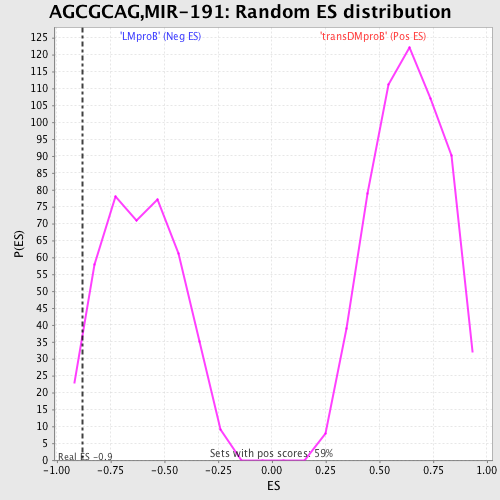
| GeneSet | AGCGCAG,MIR-191 |
| Enrichment Score (ES) | -0.8796296 |
| Normalized Enrichment Score (NES) | -1.4435289 |
| Nominal p-value | 0.04368932 |
| FDR q-value | 0.4641972 |
| FWER p-Value | 0.995 |
| PROBE | DESCRIPTION (from dataset) | GENE SYMBOL | GENE_TITLE | RANK IN GENE LIST | RANK METRIC SCORE | RUNNING ES | CORE ENRICHMENT | |
|---|---|---|---|---|---|---|---|---|
| 1 | ETF1 | 23467 | 3435 | 0.041 | -0.1620 | No | ||
| 2 | MAGI1 | 19828 4816 1179 | 5918 | 0.010 | -0.2900 | No | ||
| 3 | CHRD | 22817 | 6408 | 0.008 | -0.3119 | No | ||
| 4 | HMGB1 | 9094 4855 | 6876 | 0.006 | -0.3335 | No | ||
| 5 | DIO3 | 19359 | 13209 | -0.008 | -0.6695 | No | ||
| 6 | EGR3 | 4656 | 13887 | -0.011 | -0.7001 | No | ||
| 7 | SPEN | 12112 | 16530 | -0.077 | -0.7997 | Yes | ||
| 8 | OGT | 4241 24274 | 18019 | -0.350 | -0.6883 | Yes | ||
| 9 | SNRP70 | 1186 | 18200 | -0.440 | -0.4571 | Yes | ||
| 10 | UBAP2 | 15912 | 18486 | -0.876 | 0.0070 | Yes |