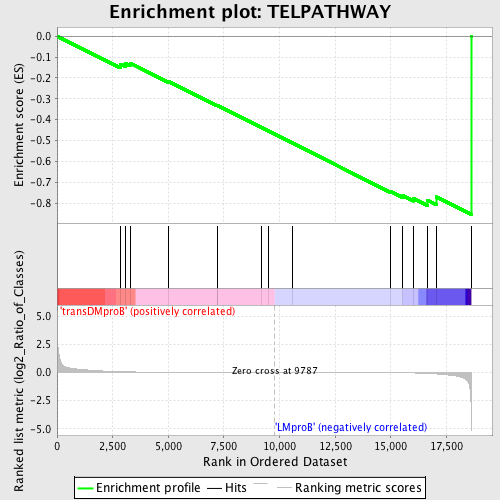
Profile of the Running ES Score & Positions of GeneSet Members on the Rank Ordered List
| Dataset | Set_04_transDMproB_versus_LMproB.phenotype_transDMproB_versus_LMproB.cls #transDMproB_versus_LMproB |
| Phenotype | phenotype_transDMproB_versus_LMproB.cls#transDMproB_versus_LMproB |
| Upregulated in class | LMproB |
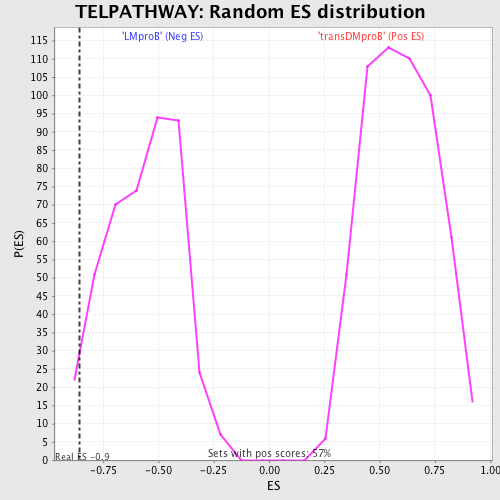
| GeneSet | TELPATHWAY |
| Enrichment Score (ES) | -0.8549934 |
| Normalized Enrichment Score (NES) | -1.5121293 |
| Nominal p-value | 0.027586207 |
| FDR q-value | 0.8403923 |
| FWER p-Value | 0.986 |
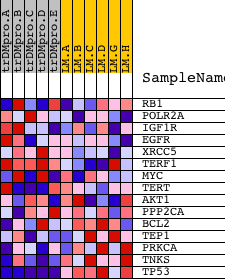
| PROBE | DESCRIPTION (from dataset) | GENE SYMBOL | GENE_TITLE | RANK IN GENE LIST | RANK METRIC SCORE | RUNNING ES | CORE ENRICHMENT | |
|---|---|---|---|---|---|---|---|---|
| 1 | RB1 | 21754 | 2835 | 0.067 | -0.1335 | No | ||
| 2 | POLR2A | 5394 | 3083 | 0.054 | -0.1314 | No | ||
| 3 | IGF1R | 9157 | 3281 | 0.046 | -0.1288 | No | ||
| 4 | EGFR | 1329 20944 | 4992 | 0.015 | -0.2165 | No | ||
| 5 | XRCC5 | 14229 | 7189 | 0.006 | -0.3329 | No | ||
| 6 | TERF1 | 14293 | 7219 | 0.005 | -0.3330 | No | ||
| 7 | MYC | 22465 9435 | 9167 | 0.001 | -0.4373 | No | ||
| 8 | TERT | 21604 | 9489 | 0.001 | -0.4544 | No | ||
| 9 | AKT1 | 8568 | 10560 | -0.001 | -0.5115 | No | ||
| 10 | PPP2CA | 20890 | 14993 | -0.019 | -0.7443 | No | ||
| 11 | BCL2 | 8651 3928 13864 4435 981 4062 13863 4027 | 15543 | -0.029 | -0.7655 | No | ||
| 12 | TEP1 | 21849 | 16008 | -0.046 | -0.7774 | No | ||
| 13 | PRKCA | 20174 | 16649 | -0.088 | -0.7868 | Yes | ||
| 14 | TNKS | 5786 | 17046 | -0.131 | -0.7710 | Yes | ||
| 15 | TP53 | 20822 | 18610 | -3.019 | 0.0003 | Yes |