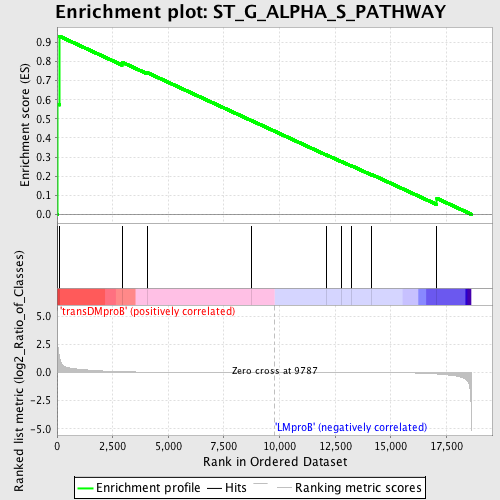
Profile of the Running ES Score & Positions of GeneSet Members on the Rank Ordered List
| Dataset | Set_04_transDMproB_versus_LMproB.phenotype_transDMproB_versus_LMproB.cls #transDMproB_versus_LMproB |
| Phenotype | phenotype_transDMproB_versus_LMproB.cls#transDMproB_versus_LMproB |
| Upregulated in class | transDMproB |
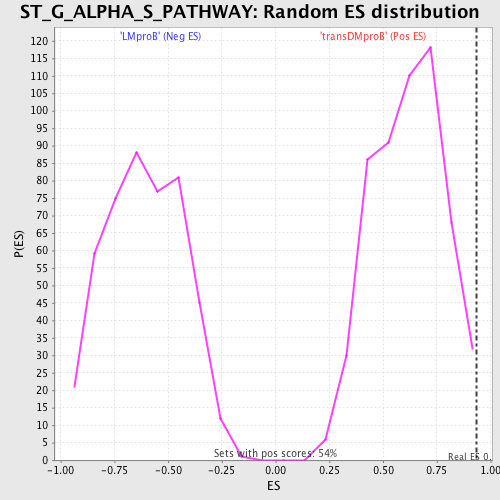
| GeneSet | ST_G_ALPHA_S_PATHWAY |
| Enrichment Score (ES) | 0.93343234 |
| Normalized Enrichment Score (NES) | 1.5127976 |
| Nominal p-value | 0.0036968577 |
| FDR q-value | 0.6333242 |
| FWER p-Value | 0.959 |
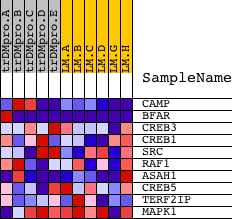
| PROBE | DESCRIPTION (from dataset) | GENE SYMBOL | GENE_TITLE | RANK IN GENE LIST | RANK METRIC SCORE | RUNNING ES | CORE ENRICHMENT | |
|---|---|---|---|---|---|---|---|---|
| 1 | CAMP | 18990 | 22 | 2.405 | 0.5763 | Yes | ||
| 2 | BFAR | 12470 1726 1671 | 94 | 1.503 | 0.9334 | Yes | ||
| 3 | CREB3 | 16231 | 2918 | 0.062 | 0.7967 | No | ||
| 4 | CREB1 | 3990 8782 4558 4093 | 4065 | 0.026 | 0.7414 | No | ||
| 5 | SRC | 5507 | 8725 | 0.002 | 0.4915 | No | ||
| 6 | RAF1 | 17035 | 12094 | -0.005 | 0.3116 | No | ||
| 7 | ASAH1 | 3835 3853 8630 | 12782 | -0.006 | 0.2762 | No | ||
| 8 | CREB5 | 10551 | 13237 | -0.008 | 0.2537 | No | ||
| 9 | TERF2IP | 12184 18463 7167 | 14142 | -0.012 | 0.2080 | No | ||
| 10 | MAPK1 | 1642 11167 | 17069 | -0.135 | 0.0831 | No |