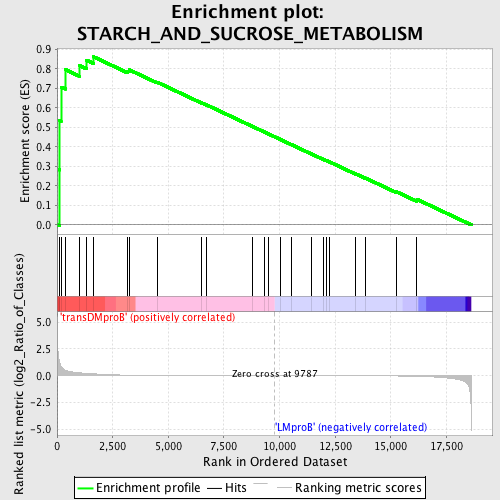
Profile of the Running ES Score & Positions of GeneSet Members on the Rank Ordered List
| Dataset | Set_04_transDMproB_versus_LMproB.phenotype_transDMproB_versus_LMproB.cls #transDMproB_versus_LMproB |
| Phenotype | phenotype_transDMproB_versus_LMproB.cls#transDMproB_versus_LMproB |
| Upregulated in class | transDMproB |
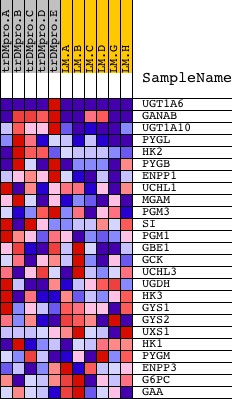
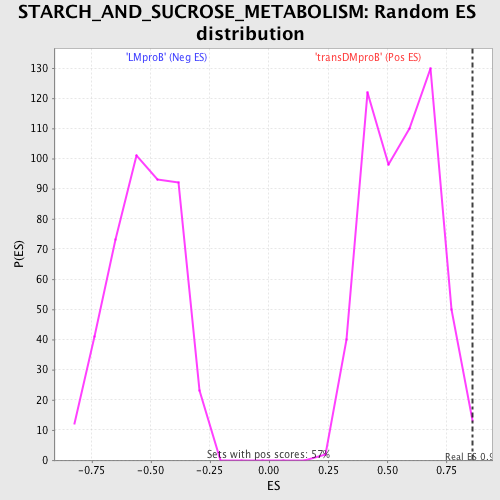
| GeneSet | STARCH_AND_SUCROSE_METABOLISM |
| Enrichment Score (ES) | 0.86218375 |
| Normalized Enrichment Score (NES) | 1.5328087 |
| Nominal p-value | 0.0017699115 |
| FDR q-value | 0.55800253 |
| FWER p-Value | 0.887 |
| PROBE | DESCRIPTION (from dataset) | GENE SYMBOL | GENE_TITLE | RANK IN GENE LIST | RANK METRIC SCORE | RUNNING ES | CORE ENRICHMENT | |
|---|---|---|---|---|---|---|---|---|
| 1 | UGT1A6 | 3969 4079 6911 13591 | 101 | 1.455 | 0.2825 | Yes | ||
| 2 | GANAB | 8992 23937 | 118 | 1.279 | 0.5349 | Yes | ||
| 3 | UGT1A10 | 6908 | 179 | 0.887 | 0.7072 | Yes | ||
| 4 | PYGL | 21046 | 369 | 0.504 | 0.7968 | Yes | ||
| 5 | HK2 | 17106 | 995 | 0.279 | 0.8184 | Yes | ||
| 6 | PYGB | 14804 | 1318 | 0.222 | 0.8451 | Yes | ||
| 7 | ENPP1 | 19804 | 1643 | 0.174 | 0.8622 | Yes | ||
| 8 | UCHL1 | 16834 | 3182 | 0.050 | 0.7893 | No | ||
| 9 | MGAM | 17476 | 3244 | 0.048 | 0.7956 | No | ||
| 10 | PGM3 | 19045 | 4491 | 0.020 | 0.7325 | No | ||
| 11 | SI | 19837 3443 | 6511 | 0.008 | 0.6254 | No | ||
| 12 | PGM1 | 16841 | 6709 | 0.007 | 0.6162 | No | ||
| 13 | GBE1 | 13180 | 8793 | 0.002 | 0.5045 | No | ||
| 14 | GCK | 20535 | 9322 | 0.001 | 0.4763 | No | ||
| 15 | UCHL3 | 6956 | 9520 | 0.001 | 0.4658 | No | ||
| 16 | UGDH | 10249 | 10043 | -0.001 | 0.4378 | No | ||
| 17 | HK3 | 3224 477 | 10529 | -0.001 | 0.4120 | No | ||
| 18 | GYS1 | 4818 | 11414 | -0.003 | 0.3651 | No | ||
| 19 | GYS2 | 16941 | 11960 | -0.004 | 0.3366 | No | ||
| 20 | UXS1 | 13965 | 12121 | -0.005 | 0.3290 | No | ||
| 21 | HK1 | 4854 | 12230 | -0.005 | 0.3241 | No | ||
| 22 | PYGM | 23792 | 13422 | -0.009 | 0.2618 | No | ||
| 23 | ENPP3 | 19803 | 13852 | -0.010 | 0.2408 | No | ||
| 24 | G6PC | 20656 | 15249 | -0.023 | 0.1703 | No | ||
| 25 | GAA | 20575 | 16175 | -0.054 | 0.1313 | No |