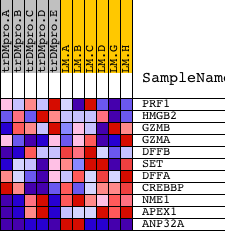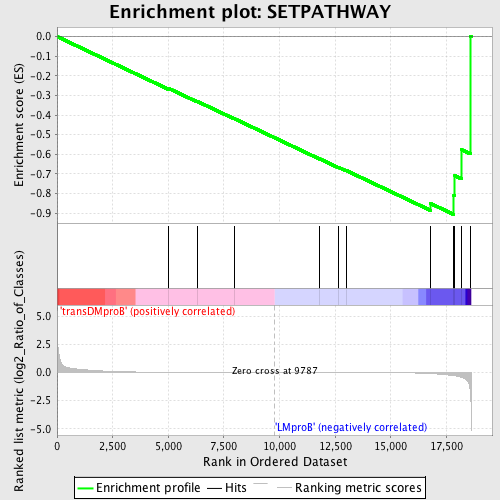
Profile of the Running ES Score & Positions of GeneSet Members on the Rank Ordered List
| Dataset | Set_04_transDMproB_versus_LMproB.phenotype_transDMproB_versus_LMproB.cls #transDMproB_versus_LMproB |
| Phenotype | phenotype_transDMproB_versus_LMproB.cls#transDMproB_versus_LMproB |
| Upregulated in class | LMproB |
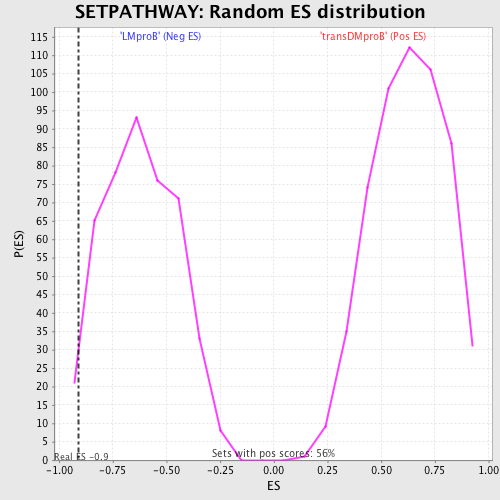
| GeneSet | SETPATHWAY |
| Enrichment Score (ES) | -0.90716624 |
| Normalized Enrichment Score (NES) | -1.4662952 |
| Nominal p-value | 0.015730336 |
| FDR q-value | 0.6620068 |
| FWER p-Value | 0.998 |
| PROBE | DESCRIPTION (from dataset) | GENE SYMBOL | GENE_TITLE | RANK IN GENE LIST | RANK METRIC SCORE | RUNNING ES | CORE ENRICHMENT | |
|---|---|---|---|---|---|---|---|---|
| 1 | PRF1 | 20011 | 5027 | 0.015 | -0.2650 | No | ||
| 2 | HMGB2 | 13594 | 6299 | 0.008 | -0.3304 | No | ||
| 3 | GZMB | 21810 | 7958 | 0.004 | -0.4183 | No | ||
| 4 | GZMA | 21343 | 11801 | -0.004 | -0.6234 | No | ||
| 5 | DFFB | 15654 | 12626 | -0.006 | -0.6656 | No | ||
| 6 | SET | 7070 | 12993 | -0.007 | -0.6828 | No | ||
| 7 | DFFA | 4627 | 16790 | -0.102 | -0.8513 | Yes | ||
| 8 | CREBBP | 22682 8783 | 17830 | -0.281 | -0.8095 | Yes | ||
| 9 | NME1 | 9467 | 17876 | -0.295 | -0.7091 | Yes | ||
| 10 | APEX1 | 22028 | 18178 | -0.426 | -0.5771 | Yes | ||
| 11 | ANP32A | 8592 4387 19415 | 18574 | -1.725 | 0.0023 | Yes |