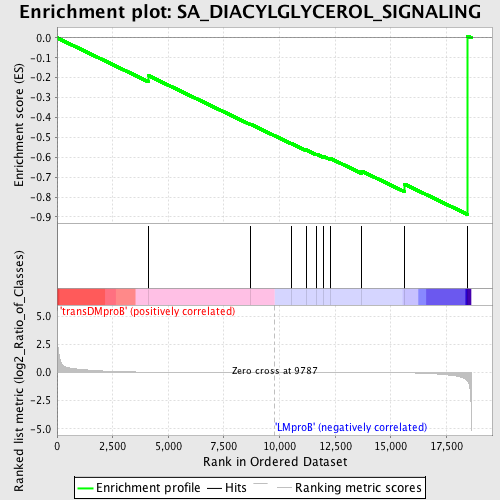
Profile of the Running ES Score & Positions of GeneSet Members on the Rank Ordered List
| Dataset | Set_04_transDMproB_versus_LMproB.phenotype_transDMproB_versus_LMproB.cls #transDMproB_versus_LMproB |
| Phenotype | phenotype_transDMproB_versus_LMproB.cls#transDMproB_versus_LMproB |
| Upregulated in class | LMproB |
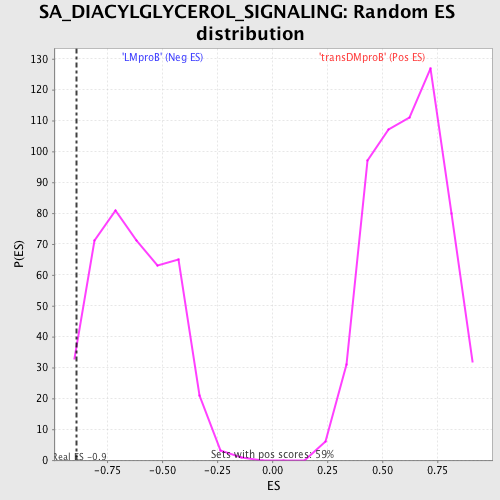
| GeneSet | SA_DIACYLGLYCEROL_SIGNALING |
| Enrichment Score (ES) | -0.88770175 |
| Normalized Enrichment Score (NES) | -1.4201096 |
| Nominal p-value | 0.04400978 |
| FDR q-value | 0.7751938 |
| FWER p-Value | 1.0 |
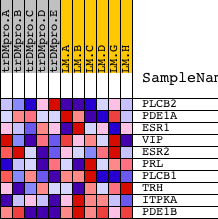
| PROBE | DESCRIPTION (from dataset) | GENE SYMBOL | GENE_TITLE | RANK IN GENE LIST | RANK METRIC SCORE | RUNNING ES | CORE ENRICHMENT | |
|---|---|---|---|---|---|---|---|---|
| 1 | PLCB2 | 5262 | 4097 | 0.026 | -0.1894 | No | ||
| 2 | PDE1A | 9541 5234 | 8704 | 0.002 | -0.4345 | No | ||
| 3 | ESR1 | 20097 4685 | 10530 | -0.001 | -0.5309 | No | ||
| 4 | VIP | 20096 | 11190 | -0.003 | -0.5632 | No | ||
| 5 | ESR2 | 21038 | 11662 | -0.004 | -0.5840 | No | ||
| 6 | PRL | 21690 | 11988 | -0.004 | -0.5962 | No | ||
| 7 | PLCB1 | 14832 2821 | 12277 | -0.005 | -0.6056 | No | ||
| 8 | TRH | 17064 | 13694 | -0.010 | -0.6700 | No | ||
| 9 | ITPKA | 14898 | 15621 | -0.032 | -0.7356 | Yes | ||
| 10 | PDE1B | 9542 | 18452 | -0.747 | 0.0088 | Yes |