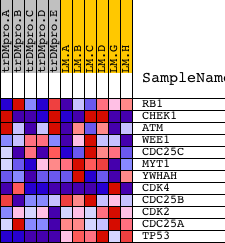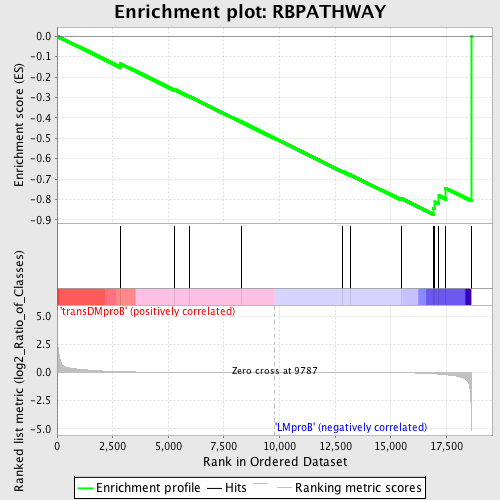
Profile of the Running ES Score & Positions of GeneSet Members on the Rank Ordered List
| Dataset | Set_04_transDMproB_versus_LMproB.phenotype_transDMproB_versus_LMproB.cls #transDMproB_versus_LMproB |
| Phenotype | phenotype_transDMproB_versus_LMproB.cls#transDMproB_versus_LMproB |
| Upregulated in class | LMproB |
| GeneSet | RBPATHWAY |
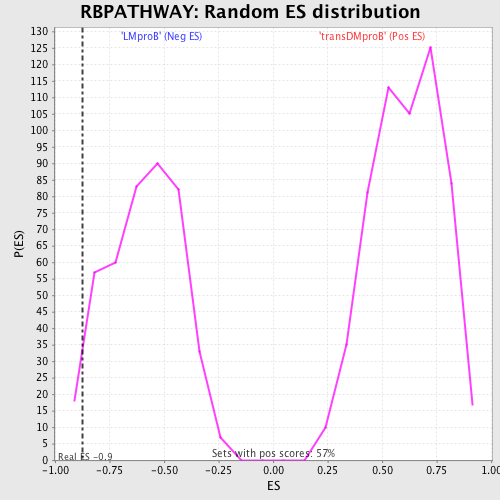
| Enrichment Score (ES) | -0.87357616 |
| Normalized Enrichment Score (NES) | -1.47882 |
| Nominal p-value | 0.03255814 |
| FDR q-value | 0.7010367 |
| FWER p-Value | 0.998 |
| PROBE | DESCRIPTION (from dataset) | GENE SYMBOL | GENE_TITLE | RANK IN GENE LIST | RANK METRIC SCORE | RUNNING ES | CORE ENRICHMENT | |
|---|---|---|---|---|---|---|---|---|
| 1 | RB1 | 21754 | 2835 | 0.067 | -0.1345 | No | ||
| 2 | CHEK1 | 19181 3085 | 5275 | 0.013 | -0.2621 | No | ||
| 3 | ATM | 2976 19115 | 5945 | 0.010 | -0.2954 | No | ||
| 4 | WEE1 | 18127 | 8265 | 0.003 | -0.4193 | No | ||
| 5 | CDC25C | 23468 1954 1977 | 12842 | -0.007 | -0.6635 | No | ||
| 6 | MYT1 | 36 | 13181 | -0.008 | -0.6796 | No | ||
| 7 | YWHAH | 5937 10368 | 15458 | -0.027 | -0.7946 | No | ||
| 8 | CDK4 | 3424 19859 | 16928 | -0.116 | -0.8425 | Yes | ||
| 9 | CDC25B | 14841 | 16984 | -0.124 | -0.8123 | Yes | ||
| 10 | CDK2 | 3438 3373 19592 3322 | 17164 | -0.148 | -0.7824 | Yes | ||
| 11 | CDC25A | 8721 | 17457 | -0.198 | -0.7451 | Yes | ||
| 12 | TP53 | 20822 | 18610 | -3.019 | 0.0003 | Yes |