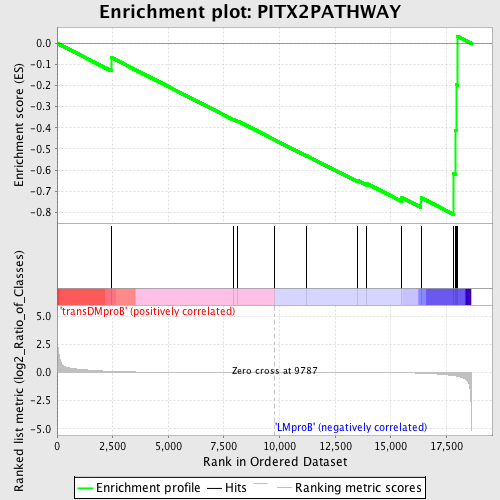
Profile of the Running ES Score & Positions of GeneSet Members on the Rank Ordered List
| Dataset | Set_04_transDMproB_versus_LMproB.phenotype_transDMproB_versus_LMproB.cls #transDMproB_versus_LMproB |
| Phenotype | phenotype_transDMproB_versus_LMproB.cls#transDMproB_versus_LMproB |
| Upregulated in class | LMproB |
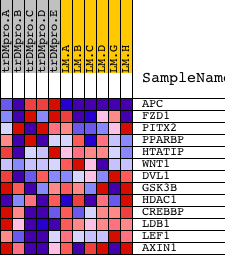
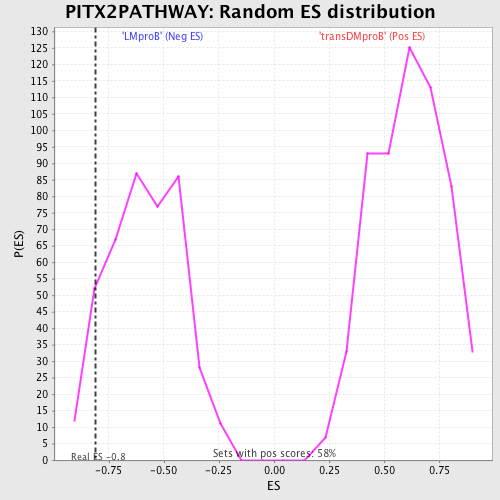
| GeneSet | PITX2PATHWAY |
| Enrichment Score (ES) | -0.8104893 |
| Normalized Enrichment Score (NES) | -1.3874407 |
| Nominal p-value | 0.07619048 |
| FDR q-value | 0.8142199 |
| FWER p-Value | 1.0 |
| PROBE | DESCRIPTION (from dataset) | GENE SYMBOL | GENE_TITLE | RANK IN GENE LIST | RANK METRIC SCORE | RUNNING ES | CORE ENRICHMENT | |
|---|---|---|---|---|---|---|---|---|
| 1 | APC | 4396 2022 | 2443 | 0.092 | -0.0679 | No | ||
| 2 | FZD1 | 16923 | 7933 | 0.004 | -0.3604 | No | ||
| 3 | PITX2 | 15424 1878 | 8121 | 0.003 | -0.3683 | No | ||
| 4 | PPARBP | 1203 20263 1195 | 9774 | 0.000 | -0.4571 | No | ||
| 5 | HTATIP | 3690 | 11227 | -0.003 | -0.5333 | No | ||
| 6 | WNT1 | 22371 | 13491 | -0.009 | -0.6488 | No | ||
| 7 | DVL1 | 2412 15960 | 13914 | -0.011 | -0.6641 | No | ||
| 8 | GSK3B | 22761 | 15479 | -0.028 | -0.7292 | No | ||
| 9 | HDAC1 | 9081 | 16356 | -0.065 | -0.7313 | Yes | ||
| 10 | CREBBP | 22682 8783 | 17830 | -0.281 | -0.6175 | Yes | ||
| 11 | LDB1 | 23654 | 17896 | -0.304 | -0.4123 | Yes | ||
| 12 | LEF1 | 1860 15420 | 17935 | -0.318 | -0.1955 | Yes | ||
| 13 | AXIN1 | 1579 23330 | 17988 | -0.337 | 0.0338 | Yes |