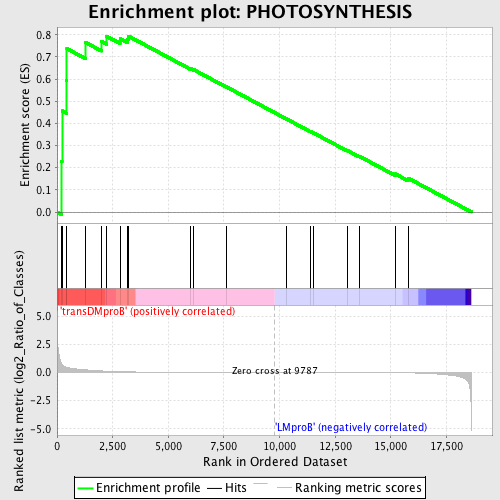
Profile of the Running ES Score & Positions of GeneSet Members on the Rank Ordered List
| Dataset | Set_04_transDMproB_versus_LMproB.phenotype_transDMproB_versus_LMproB.cls #transDMproB_versus_LMproB |
| Phenotype | phenotype_transDMproB_versus_LMproB.cls#transDMproB_versus_LMproB |
| Upregulated in class | transDMproB |
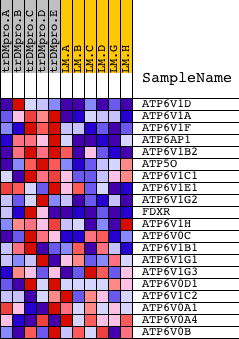
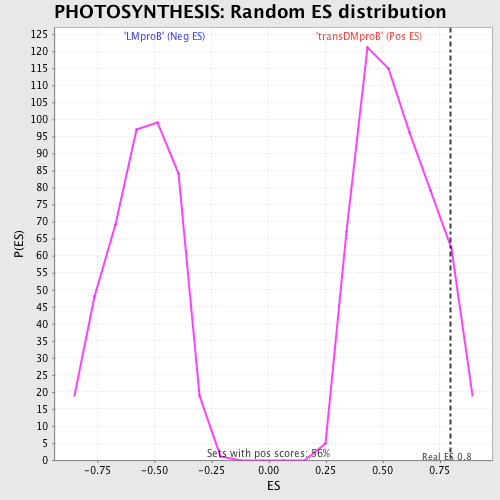
| GeneSet | PHOTOSYNTHESIS |
| Enrichment Score (ES) | 0.7941787 |
| Normalized Enrichment Score (NES) | 1.4081367 |
| Nominal p-value | 0.08510638 |
| FDR q-value | 0.9028556 |
| FWER p-Value | 1.0 |
| PROBE | DESCRIPTION (from dataset) | GENE SYMBOL | GENE_TITLE | RANK IN GENE LIST | RANK METRIC SCORE | RUNNING ES | CORE ENRICHMENT | |
|---|---|---|---|---|---|---|---|---|
| 1 | ATP6V1D | 7872 | 208 | 0.750 | 0.2295 | Yes | ||
| 2 | ATP6V1A | 8638 | 223 | 0.709 | 0.4564 | Yes | ||
| 3 | ATP6V1F | 12291 | 419 | 0.462 | 0.5943 | Yes | ||
| 4 | ATP6AP1 | 24296 | 440 | 0.449 | 0.7374 | Yes | ||
| 5 | ATP6V1B2 | 18599 | 1276 | 0.228 | 0.7656 | Yes | ||
| 6 | ATP5O | 22539 | 1996 | 0.133 | 0.7697 | Yes | ||
| 7 | ATP6V1C1 | 22487 12329 | 2223 | 0.111 | 0.7933 | Yes | ||
| 8 | ATP6V1E1 | 4423 | 2830 | 0.067 | 0.7822 | Yes | ||
| 9 | ATP6V1G2 | 23257 1534 | 3166 | 0.051 | 0.7804 | Yes | ||
| 10 | FDXR | 1451 20154 | 3205 | 0.049 | 0.7942 | Yes | ||
| 11 | ATP6V1H | 14301 | 5985 | 0.010 | 0.6478 | No | ||
| 12 | ATP6V0C | 8643 | 6133 | 0.009 | 0.6428 | No | ||
| 13 | ATP6V1B1 | 8499 | 7594 | 0.004 | 0.5657 | No | ||
| 14 | ATP6V1G1 | 12322 | 10293 | -0.001 | 0.4209 | No | ||
| 15 | ATP6V1G3 | 14107 | 11395 | -0.003 | 0.3627 | No | ||
| 16 | ATP6V0D1 | 3895 8639 3920 | 11536 | -0.003 | 0.3563 | No | ||
| 17 | ATP6V1C2 | 21098 | 13041 | -0.007 | 0.2777 | No | ||
| 18 | ATP6V0A1 | 8640 4424 1197 | 13577 | -0.009 | 0.2519 | No | ||
| 19 | ATP6V0A4 | 8934 | 15200 | -0.022 | 0.1719 | No | ||
| 20 | ATP6V0B | 15786 | 15777 | -0.036 | 0.1527 | No |