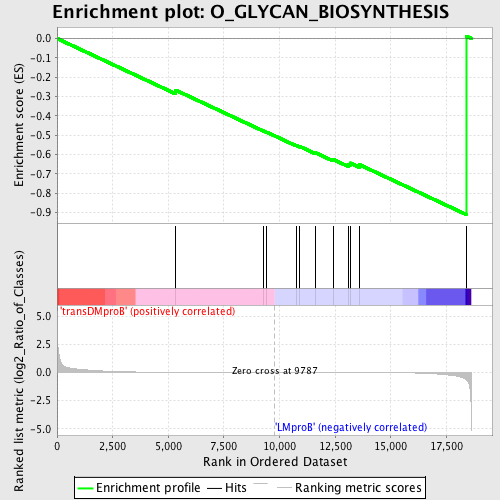
Profile of the Running ES Score & Positions of GeneSet Members on the Rank Ordered List
| Dataset | Set_04_transDMproB_versus_LMproB.phenotype_transDMproB_versus_LMproB.cls #transDMproB_versus_LMproB |
| Phenotype | phenotype_transDMproB_versus_LMproB.cls#transDMproB_versus_LMproB |
| Upregulated in class | LMproB |
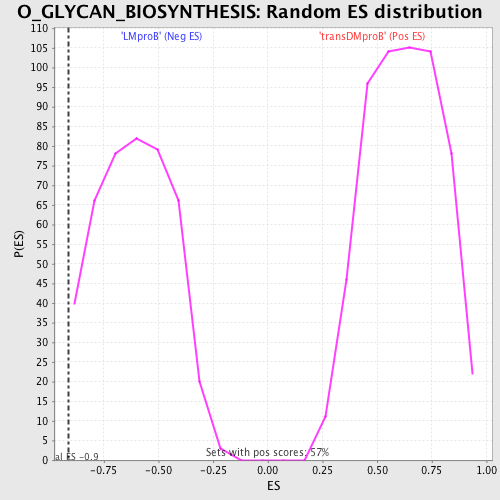
| GeneSet | O_GLYCAN_BIOSYNTHESIS |
| Enrichment Score (ES) | -0.9104859 |
| Normalized Enrichment Score (NES) | -1.5022619 |
| Nominal p-value | 0.016129032 |
| FDR q-value | 0.6843824 |
| FWER p-Value | 0.994 |
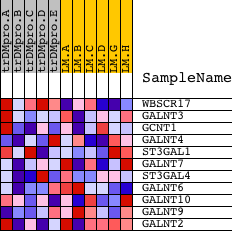
| PROBE | DESCRIPTION (from dataset) | GENE SYMBOL | GENE_TITLE | RANK IN GENE LIST | RANK METRIC SCORE | RUNNING ES | CORE ENRICHMENT | |
|---|---|---|---|---|---|---|---|---|
| 1 | WBSCR17 | 16357 | 5333 | 0.013 | -0.2674 | No | ||
| 2 | GALNT3 | 4751 | 9286 | 0.001 | -0.4784 | No | ||
| 3 | GCNT1 | 23715 3749 3689 | 9419 | 0.001 | -0.4844 | No | ||
| 4 | GALNT4 | 19892 | 10754 | -0.002 | -0.5534 | No | ||
| 5 | ST3GAL1 | 5435 2227 | 10906 | -0.002 | -0.5584 | No | ||
| 6 | GALNT7 | 18870 | 11607 | -0.004 | -0.5908 | No | ||
| 7 | ST3GAL4 | 9816 | 12405 | -0.005 | -0.6256 | No | ||
| 8 | GALNT6 | 22126 | 13089 | -0.007 | -0.6512 | No | ||
| 9 | GALNT10 | 9345 1269 | 13170 | -0.008 | -0.6440 | No | ||
| 10 | GALNT9 | 16753 | 13583 | -0.009 | -0.6524 | Yes | ||
| 11 | GALNT2 | 4239 18424 | 18386 | -0.620 | 0.0124 | Yes |