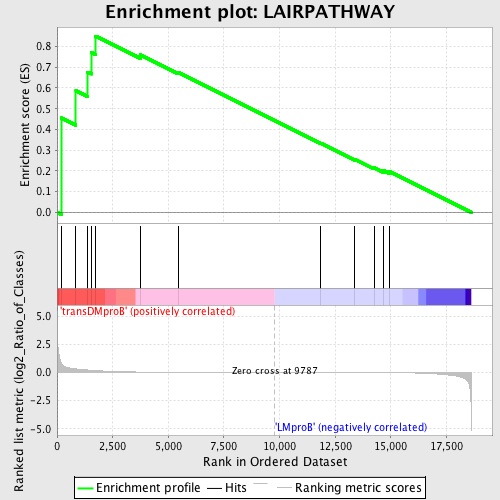
Profile of the Running ES Score & Positions of GeneSet Members on the Rank Ordered List
| Dataset | Set_04_transDMproB_versus_LMproB.phenotype_transDMproB_versus_LMproB.cls #transDMproB_versus_LMproB |
| Phenotype | phenotype_transDMproB_versus_LMproB.cls#transDMproB_versus_LMproB |
| Upregulated in class | transDMproB |
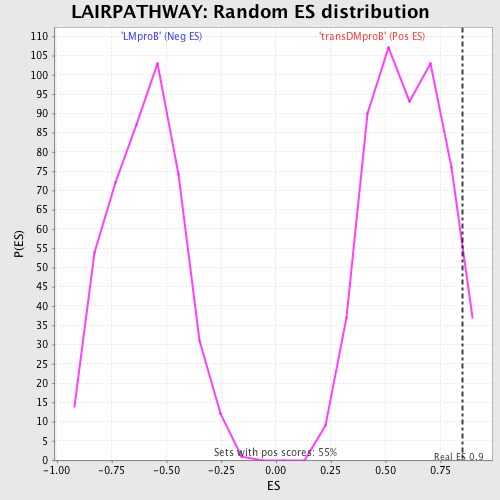
| GeneSet | LAIRPATHWAY |
| Enrichment Score (ES) | 0.85006595 |
| Normalized Enrichment Score (NES) | 1.4236128 |
| Nominal p-value | 0.0634058 |
| FDR q-value | 0.9486533 |
| FWER p-Value | 1.0 |
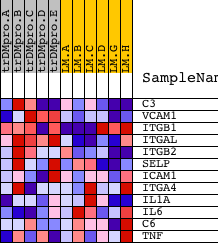
| PROBE | DESCRIPTION (from dataset) | GENE SYMBOL | GENE_TITLE | RANK IN GENE LIST | RANK METRIC SCORE | RUNNING ES | CORE ENRICHMENT | |
|---|---|---|---|---|---|---|---|---|
| 1 | C3 | 22915 | 184 | 0.857 | 0.4559 | Yes | ||
| 2 | VCAM1 | 5851 | 846 | 0.306 | 0.5865 | Yes | ||
| 3 | ITGB1 | 3872 18411 | 1364 | 0.217 | 0.6765 | Yes | ||
| 4 | ITGAL | 9187 | 1535 | 0.191 | 0.7712 | Yes | ||
| 5 | ITGB2 | 19978 | 1734 | 0.165 | 0.8501 | Yes | ||
| 6 | SELP | 14073 | 3741 | 0.033 | 0.7602 | No | ||
| 7 | ICAM1 | 19545 | 5436 | 0.012 | 0.6759 | No | ||
| 8 | ITGA4 | 4929 | 11853 | -0.004 | 0.3333 | No | ||
| 9 | IL1A | 4915 | 13375 | -0.008 | 0.2561 | No | ||
| 10 | IL6 | 16895 | 14243 | -0.013 | 0.2163 | No | ||
| 11 | C6 | 22522 8671 | 14671 | -0.016 | 0.2019 | No | ||
| 12 | TNF | 23004 | 14931 | -0.019 | 0.1981 | No |