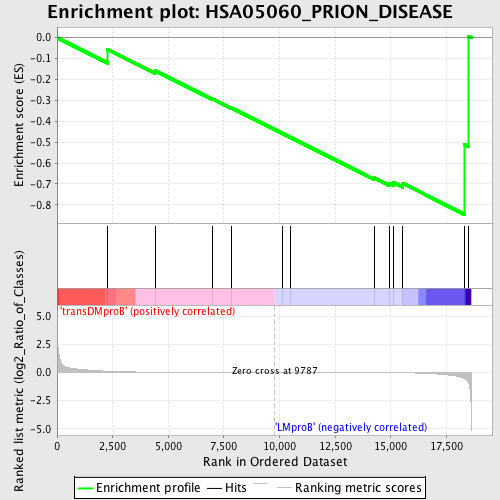
Profile of the Running ES Score & Positions of GeneSet Members on the Rank Ordered List
| Dataset | Set_04_transDMproB_versus_LMproB.phenotype_transDMproB_versus_LMproB.cls #transDMproB_versus_LMproB |
| Phenotype | phenotype_transDMproB_versus_LMproB.cls#transDMproB_versus_LMproB |
| Upregulated in class | LMproB |
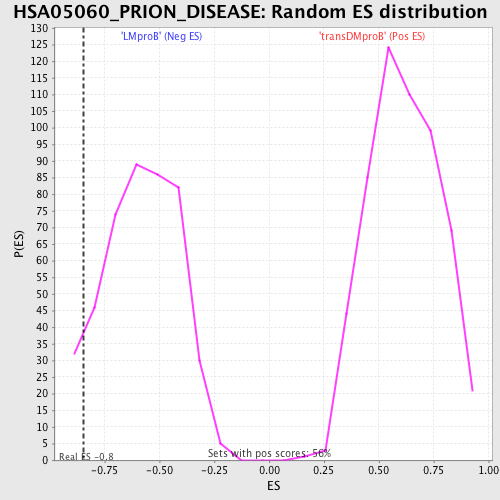
| GeneSet | HSA05060_PRION_DISEASE |
| Enrichment Score (ES) | -0.84616226 |
| Normalized Enrichment Score (NES) | -1.4524239 |
| Nominal p-value | 0.067567565 |
| FDR q-value | 0.59800804 |
| FWER p-Value | 0.999 |
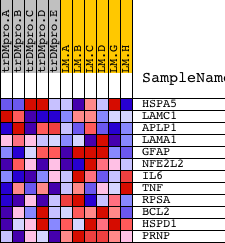
| PROBE | DESCRIPTION (from dataset) | GENE SYMBOL | GENE_TITLE | RANK IN GENE LIST | RANK METRIC SCORE | RUNNING ES | CORE ENRICHMENT | |
|---|---|---|---|---|---|---|---|---|
| 1 | HSPA5 | 9045 | 2275 | 0.105 | -0.0562 | No | ||
| 2 | LAMC1 | 13805 | 4434 | 0.021 | -0.1593 | No | ||
| 3 | APLP1 | 17890 | 6994 | 0.006 | -0.2930 | No | ||
| 4 | LAMA1 | 23168 | 7849 | 0.004 | -0.3365 | No | ||
| 5 | GFAP | 4774 | 10152 | -0.001 | -0.4598 | No | ||
| 6 | NFE2L2 | 2898 14557 | 10482 | -0.001 | -0.4766 | No | ||
| 7 | IL6 | 16895 | 14243 | -0.013 | -0.6708 | No | ||
| 8 | TNF | 23004 | 14931 | -0.019 | -0.6961 | No | ||
| 9 | RPSA | 19270 4984 | 15132 | -0.021 | -0.6935 | No | ||
| 10 | BCL2 | 8651 3928 13864 4435 981 4062 13863 4027 | 15543 | -0.029 | -0.6972 | Yes | ||
| 11 | HSPD1 | 4078 9129 | 18315 | -0.533 | -0.5116 | Yes | ||
| 12 | PRNP | 9622 | 18481 | -0.841 | 0.0073 | Yes |