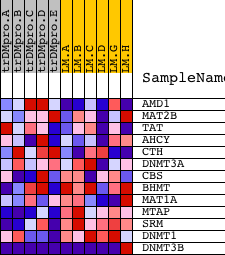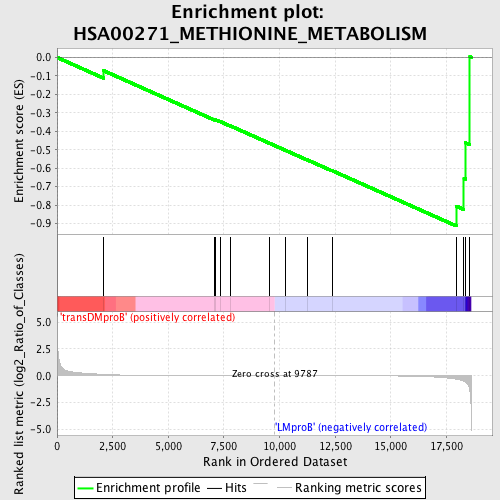
Profile of the Running ES Score & Positions of GeneSet Members on the Rank Ordered List
| Dataset | Set_04_transDMproB_versus_LMproB.phenotype_transDMproB_versus_LMproB.cls #transDMproB_versus_LMproB |
| Phenotype | phenotype_transDMproB_versus_LMproB.cls#transDMproB_versus_LMproB |
| Upregulated in class | LMproB |
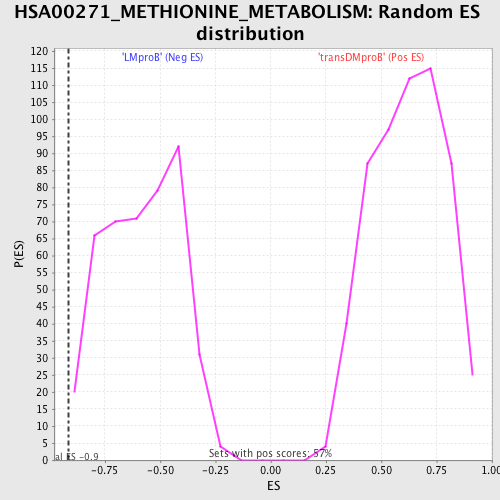
| GeneSet | HSA00271_METHIONINE_METABOLISM |
| Enrichment Score (ES) | -0.91322803 |
| Normalized Enrichment Score (NES) | -1.5733008 |
| Nominal p-value | 0.011547344 |
| FDR q-value | 0.5665756 |
| FWER p-Value | 0.818 |
| PROBE | DESCRIPTION (from dataset) | GENE SYMBOL | GENE_TITLE | RANK IN GENE LIST | RANK METRIC SCORE | RUNNING ES | CORE ENRICHMENT | |
|---|---|---|---|---|---|---|---|---|
| 1 | AMD1 | 8583 | 2090 | 0.122 | -0.0716 | No | ||
| 2 | MAT2B | 20494 1431 | 7072 | 0.006 | -0.3374 | No | ||
| 3 | TAT | 18468 | 7111 | 0.006 | -0.3375 | No | ||
| 4 | AHCY | 6526 | 7339 | 0.005 | -0.3480 | No | ||
| 5 | CTH | 1938 15131 | 7792 | 0.004 | -0.3710 | No | ||
| 6 | DNMT3A | 2167 21330 | 9548 | 0.000 | -0.4652 | No | ||
| 7 | CBS | 1550 23034 | 10254 | -0.001 | -0.5028 | No | ||
| 8 | BHMT | 4446 | 11232 | -0.003 | -0.5544 | No | ||
| 9 | MAT1A | 22041 | 12359 | -0.005 | -0.6131 | No | ||
| 10 | MTAP | 16178 | 17943 | -0.322 | -0.8058 | Yes | ||
| 11 | SRM | 9890 2525 | 18288 | -0.507 | -0.6552 | Yes | ||
| 12 | DNMT1 | 19217 | 18364 | -0.589 | -0.4629 | Yes | ||
| 13 | DNMT3B | 2840 14785 | 18555 | -1.428 | 0.0033 | Yes |