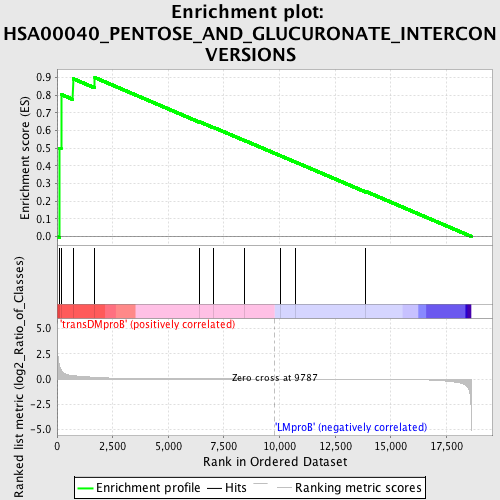
Profile of the Running ES Score & Positions of GeneSet Members on the Rank Ordered List
| Dataset | Set_04_transDMproB_versus_LMproB.phenotype_transDMproB_versus_LMproB.cls #transDMproB_versus_LMproB |
| Phenotype | phenotype_transDMproB_versus_LMproB.cls#transDMproB_versus_LMproB |
| Upregulated in class | transDMproB |
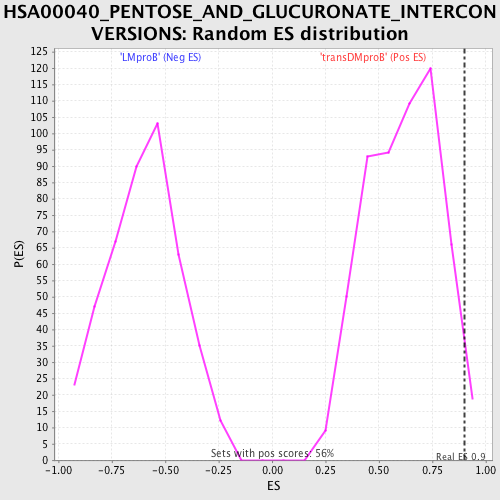
| GeneSet | HSA00040_PENTOSE_AND_GLUCURONATE_INTERCONVERSIONS |
| Enrichment Score (ES) | 0.89877707 |
| Normalized Enrichment Score (NES) | 1.460766 |
| Nominal p-value | 0.026785715 |
| FDR q-value | 0.79339117 |
| FWER p-Value | 1.0 |
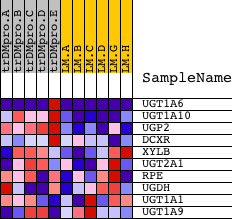
| PROBE | DESCRIPTION (from dataset) | GENE SYMBOL | GENE_TITLE | RANK IN GENE LIST | RANK METRIC SCORE | RUNNING ES | CORE ENRICHMENT | |
|---|---|---|---|---|---|---|---|---|
| 1 | UGT1A6 | 3969 4079 6911 13591 | 101 | 1.455 | 0.4998 | Yes | ||
| 2 | UGT1A10 | 6908 | 179 | 0.887 | 0.8037 | Yes | ||
| 3 | UGP2 | 20518 | 714 | 0.339 | 0.8929 | Yes | ||
| 4 | DCXR | 20108 | 1697 | 0.169 | 0.8988 | Yes | ||
| 5 | XYLB | 19277 | 6410 | 0.008 | 0.6483 | No | ||
| 6 | UGT2A1 | 8247 | 7017 | 0.006 | 0.6178 | No | ||
| 7 | RPE | 14232 | 8423 | 0.003 | 0.5432 | No | ||
| 8 | UGDH | 10249 | 10043 | -0.001 | 0.4563 | No | ||
| 9 | UGT1A1 | 11851 | 10707 | -0.002 | 0.4213 | No | ||
| 10 | UGT1A9 | 11849 11850 | 13879 | -0.011 | 0.2546 | No |