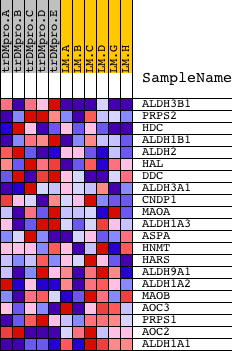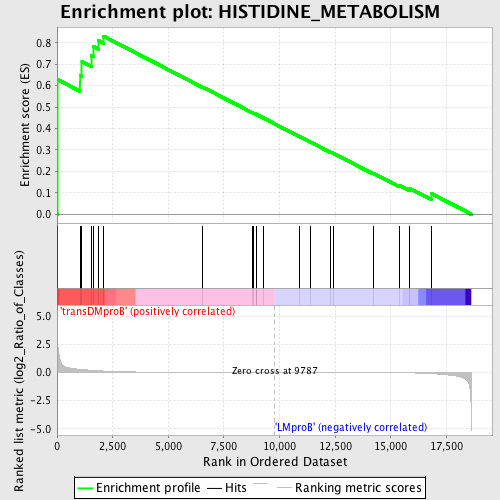
Profile of the Running ES Score & Positions of GeneSet Members on the Rank Ordered List
| Dataset | Set_04_transDMproB_versus_LMproB.phenotype_transDMproB_versus_LMproB.cls #transDMproB_versus_LMproB |
| Phenotype | phenotype_transDMproB_versus_LMproB.cls#transDMproB_versus_LMproB |
| Upregulated in class | transDMproB |
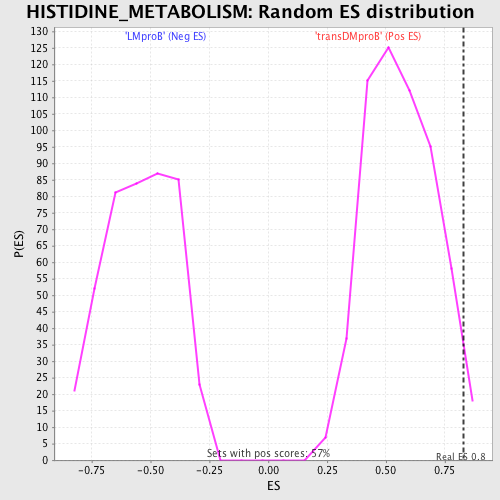
| GeneSet | HISTIDINE_METABOLISM |
| Enrichment Score (ES) | 0.83131176 |
| Normalized Enrichment Score (NES) | 1.4781429 |
| Nominal p-value | 0.024691358 |
| FDR q-value | 0.7028925 |
| FWER p-Value | 0.997 |
| PROBE | DESCRIPTION (from dataset) | GENE SYMBOL | GENE_TITLE | RANK IN GENE LIST | RANK METRIC SCORE | RUNNING ES | CORE ENRICHMENT | |
|---|---|---|---|---|---|---|---|---|
| 1 | ALDH3B1 | 12569 23949 | 24 | 2.342 | 0.6283 | Yes | ||
| 2 | PRPS2 | 24003 | 1028 | 0.273 | 0.6477 | Yes | ||
| 3 | HDC | 14447 | 1116 | 0.256 | 0.7117 | Yes | ||
| 4 | ALDH1B1 | 16219 | 1550 | 0.189 | 0.7392 | Yes | ||
| 5 | ALDH2 | 16384 | 1632 | 0.176 | 0.7821 | Yes | ||
| 6 | HAL | 19905 | 1873 | 0.149 | 0.8092 | Yes | ||
| 7 | DDC | 4605 | 2080 | 0.124 | 0.8313 | Yes | ||
| 8 | ALDH3A1 | 20854 | 6536 | 0.007 | 0.5938 | No | ||
| 9 | CNDP1 | 23396 | 8761 | 0.002 | 0.4747 | No | ||
| 10 | MAOA | 9368 24374 | 8815 | 0.002 | 0.4723 | No | ||
| 11 | ALDH1A3 | 17802 | 8956 | 0.002 | 0.4652 | No | ||
| 12 | ASPA | 20354 | 8957 | 0.002 | 0.4656 | No | ||
| 13 | HNMT | 14672 | 9257 | 0.001 | 0.4498 | No | ||
| 14 | HARS | 23451 | 10904 | -0.002 | 0.3619 | No | ||
| 15 | ALDH9A1 | 14064 | 11380 | -0.003 | 0.3372 | No | ||
| 16 | ALDH1A2 | 19386 | 12280 | -0.005 | 0.2902 | No | ||
| 17 | MAOB | 24182 2556 | 12428 | -0.005 | 0.2837 | No | ||
| 18 | AOC3 | 8595 | 14200 | -0.012 | 0.1918 | No | ||
| 19 | PRPS1 | 24233 | 15378 | -0.026 | 0.1355 | No | ||
| 20 | AOC2 | 20658 1256 | 15856 | -0.039 | 0.1204 | No | ||
| 21 | ALDH1A1 | 8569 | 16820 | -0.104 | 0.0966 | No |