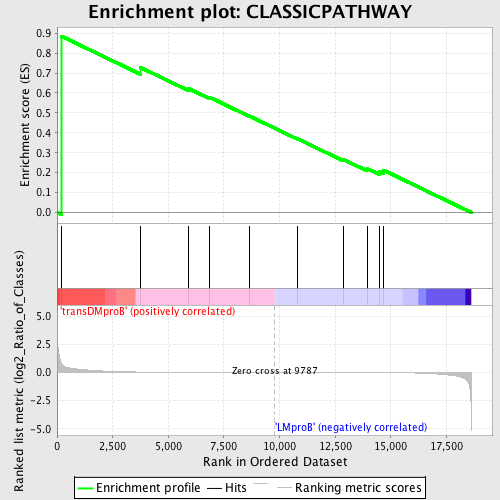
Profile of the Running ES Score & Positions of GeneSet Members on the Rank Ordered List
| Dataset | Set_04_transDMproB_versus_LMproB.phenotype_transDMproB_versus_LMproB.cls #transDMproB_versus_LMproB |
| Phenotype | phenotype_transDMproB_versus_LMproB.cls#transDMproB_versus_LMproB |
| Upregulated in class | transDMproB |
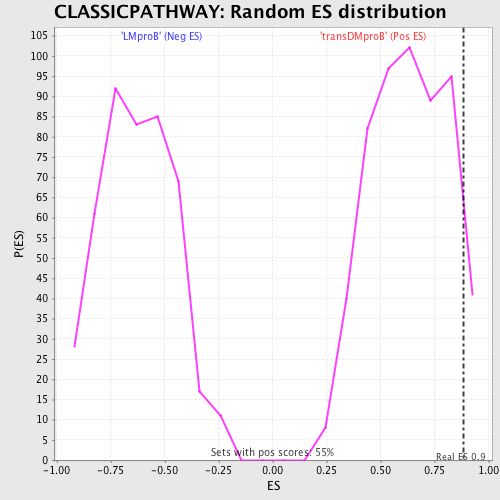
| GeneSet | CLASSICPATHWAY |
| Enrichment Score (ES) | 0.8851892 |
| Normalized Enrichment Score (NES) | 1.4033979 |
| Nominal p-value | 0.05595668 |
| FDR q-value | 0.8367711 |
| FWER p-Value | 1.0 |
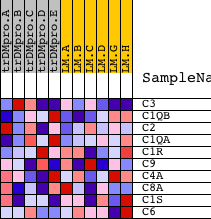
| PROBE | DESCRIPTION (from dataset) | GENE SYMBOL | GENE_TITLE | RANK IN GENE LIST | RANK METRIC SCORE | RUNNING ES | CORE ENRICHMENT | |
|---|---|---|---|---|---|---|---|---|
| 1 | C3 | 22915 | 184 | 0.857 | 0.8852 | Yes | ||
| 2 | C1QB | 8667 | 3758 | 0.033 | 0.7273 | No | ||
| 3 | C2 | 23013 | 5926 | 0.010 | 0.6211 | No | ||
| 4 | C1QA | 8666 | 6868 | 0.006 | 0.5772 | No | ||
| 5 | C1R | 11942 6951 6952 | 8640 | 0.002 | 0.4843 | No | ||
| 6 | C9 | 22518 2246 | 10794 | -0.002 | 0.3706 | No | ||
| 7 | C4A | 4460 8670 9832 8669 | 12865 | -0.007 | 0.2664 | No | ||
| 8 | C8A | 15823 | 13935 | -0.011 | 0.2203 | No | ||
| 9 | C1S | 6950 6949 | 14474 | -0.014 | 0.2062 | No | ||
| 10 | C6 | 22522 8671 | 14671 | -0.016 | 0.2120 | No |