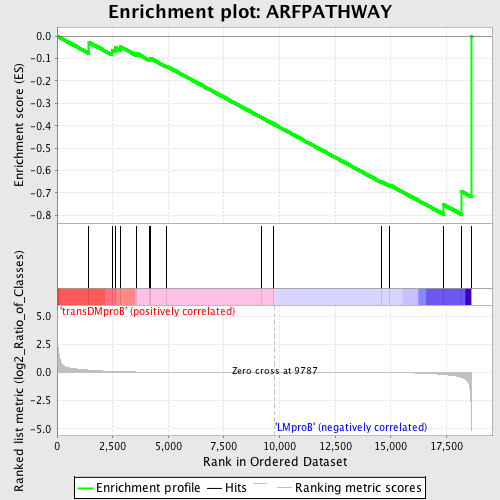
Profile of the Running ES Score & Positions of GeneSet Members on the Rank Ordered List
| Dataset | Set_04_transDMproB_versus_LMproB.phenotype_transDMproB_versus_LMproB.cls #transDMproB_versus_LMproB |
| Phenotype | phenotype_transDMproB_versus_LMproB.cls#transDMproB_versus_LMproB |
| Upregulated in class | LMproB |
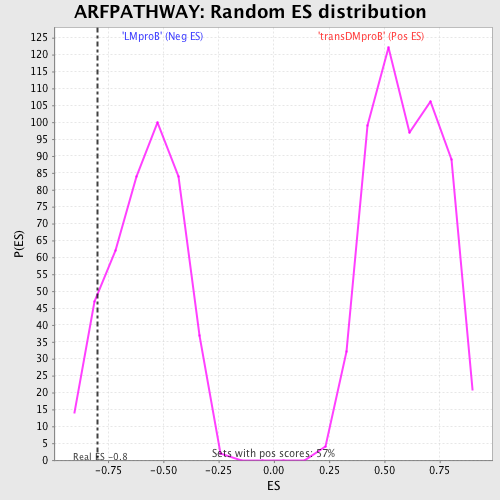
| GeneSet | ARFPATHWAY |
| Enrichment Score (ES) | -0.79609257 |
| Normalized Enrichment Score (NES) | -1.376696 |
| Nominal p-value | 0.1 |
| FDR q-value | 0.8416976 |
| FWER p-Value | 1.0 |
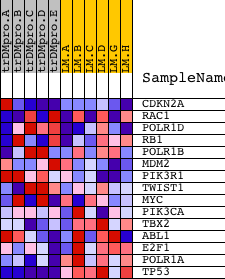
| PROBE | DESCRIPTION (from dataset) | GENE SYMBOL | GENE_TITLE | RANK IN GENE LIST | RANK METRIC SCORE | RUNNING ES | CORE ENRICHMENT | |
|---|---|---|---|---|---|---|---|---|
| 1 | CDKN2A | 2491 15841 | 1432 | 0.207 | -0.0278 | No | ||
| 2 | RAC1 | 16302 | 2467 | 0.090 | -0.0620 | No | ||
| 3 | POLR1D | 3593 3658 16623 | 2624 | 0.080 | -0.0513 | No | ||
| 4 | RB1 | 21754 | 2835 | 0.067 | -0.0468 | No | ||
| 5 | POLR1B | 14857 | 3563 | 0.038 | -0.0769 | No | ||
| 6 | MDM2 | 19620 3327 | 4155 | 0.025 | -0.1029 | No | ||
| 7 | PIK3R1 | 3170 | 4187 | 0.024 | -0.0988 | No | ||
| 8 | TWIST1 | 21291 | 4910 | 0.016 | -0.1339 | No | ||
| 9 | MYC | 22465 9435 | 9167 | 0.001 | -0.3624 | No | ||
| 10 | PIK3CA | 9562 | 9725 | 0.000 | -0.3923 | No | ||
| 11 | TBX2 | 20720 | 14564 | -0.015 | -0.6489 | No | ||
| 12 | ABL1 | 2693 4301 2794 | 14958 | -0.019 | -0.6655 | No | ||
| 13 | E2F1 | 14384 | 17360 | -0.180 | -0.7519 | Yes | ||
| 14 | POLR1A | 9749 5393 | 18184 | -0.429 | -0.6941 | Yes | ||
| 15 | TP53 | 20822 | 18610 | -3.019 | 0.0003 | Yes |