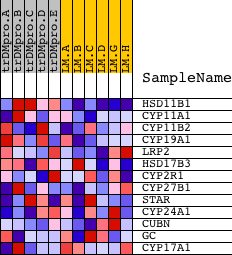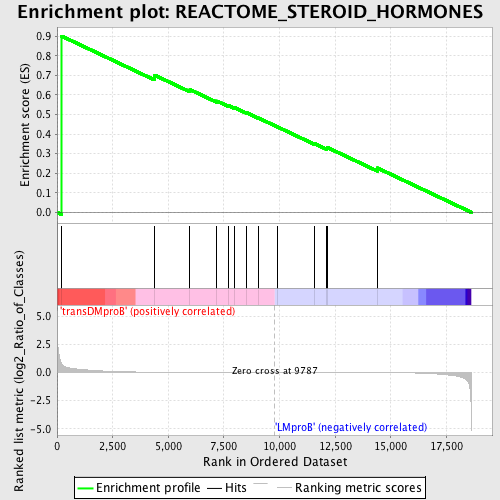
Profile of the Running ES Score & Positions of GeneSet Members on the Rank Ordered List
| Dataset | Set_04_transDMproB_versus_LMproB.phenotype_transDMproB_versus_LMproB.cls #transDMproB_versus_LMproB |
| Phenotype | phenotype_transDMproB_versus_LMproB.cls#transDMproB_versus_LMproB |
| Upregulated in class | transDMproB |
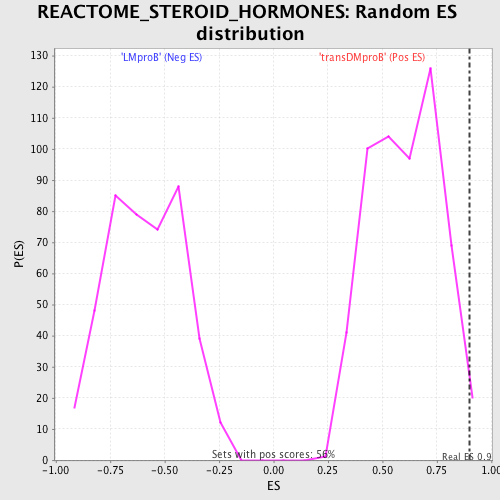
| GeneSet | REACTOME_STEROID_HORMONES |
| Enrichment Score (ES) | 0.9008732 |
| Normalized Enrichment Score (NES) | 1.4950621 |
| Nominal p-value | 0.016129032 |
| FDR q-value | 0.60339975 |
| FWER p-Value | 1.0 |
| PROBE | DESCRIPTION (from dataset) | GENE SYMBOL | GENE_TITLE | RANK IN GENE LIST | RANK METRIC SCORE | RUNNING ES | CORE ENRICHMENT | |
|---|---|---|---|---|---|---|---|---|
| 1 | HSD11B1 | 9125 4019 | 205 | 0.771 | 0.9009 | Yes | ||
| 2 | CYP11A1 | 4580 | 4375 | 0.021 | 0.7018 | No | ||
| 3 | CYP11B2 | 24574 | 5972 | 0.010 | 0.6274 | No | ||
| 4 | CYP19A1 | 19112 | 7177 | 0.006 | 0.5692 | No | ||
| 5 | LRP2 | 14566 14567 | 7719 | 0.004 | 0.5450 | No | ||
| 6 | HSD17B3 | 3231 21421 | 7970 | 0.004 | 0.5357 | No | ||
| 7 | CYP2R1 | 17668 | 8498 | 0.002 | 0.5103 | No | ||
| 8 | CYP27B1 | 8831 3426 | 9047 | 0.001 | 0.4825 | No | ||
| 9 | STAR | 5523 | 9927 | -0.000 | 0.4356 | No | ||
| 10 | CYP24A1 | 14328 | 11557 | -0.003 | 0.3521 | No | ||
| 11 | CUBN | 14682 | 12102 | -0.005 | 0.3283 | No | ||
| 12 | GC | 16486 | 12149 | -0.005 | 0.3315 | No | ||
| 13 | CYP17A1 | 23651 | 14395 | -0.014 | 0.2269 | No |