Profile of the Running ES Score & Positions of GeneSet Members on the Rank Ordered List
| Dataset | Set_04_transDMproB_versus_LMproB.phenotype_transDMproB_versus_LMproB.cls #transDMproB_versus_LMproB |
| Phenotype | phenotype_transDMproB_versus_LMproB.cls#transDMproB_versus_LMproB |
| Upregulated in class | transDMproB |
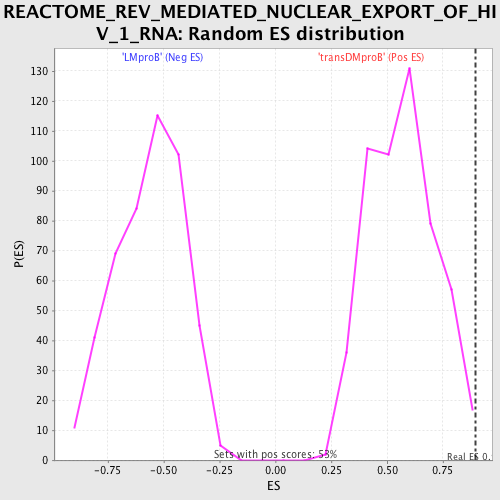
| GeneSet | REACTOME_REV_MEDIATED_NUCLEAR_EXPORT_OF_HIV_1_RNA |
| Enrichment Score (ES) | 0.8950472 |
| Normalized Enrichment Score (NES) | 1.5787042 |
| Nominal p-value | 0.009469697 |
| FDR q-value | 0.34810156 |
| FWER p-Value | 0.743 |
| PROBE | DESCRIPTION (from dataset) | GENE SYMBOL | GENE_TITLE | RANK IN GENE LIST | RANK METRIC SCORE | RUNNING ES | CORE ENRICHMENT | |
|---|---|---|---|---|---|---|---|---|
| 1 | RANBP1 | 9692 5357 | 3 | 4.557 | 0.3629 | Yes | ||
| 2 | RAN | 5356 9691 | 6 | 4.449 | 0.7173 | Yes | ||
| 3 | RANGAP1 | 2180 22195 | 37 | 2.246 | 0.8946 | Yes | ||
| 4 | NUP160 | 14957 | 585 | 0.374 | 0.8950 | Yes | ||
| 5 | NUP43 | 20094 | 1208 | 0.239 | 0.8806 | No | ||
| 6 | NUP155 | 2298 5027 | 2385 | 0.097 | 0.8251 | No | ||
| 7 | NUP54 | 11231 11232 6516 | 3167 | 0.051 | 0.7871 | No | ||
| 8 | NUP62 | 9497 | 3866 | 0.031 | 0.7520 | No | ||
| 9 | NUP35 | 12803 | 5812 | 0.010 | 0.6483 | No | ||
| 10 | NUP153 | 21474 | 6578 | 0.007 | 0.6077 | No | ||
| 11 | TPR | 927 4255 | 7165 | 0.006 | 0.5767 | No | ||
| 12 | XPO1 | 4172 | 11397 | -0.003 | 0.3494 | No | ||
| 13 | NUP37 | 3294 3326 19909 | 11749 | -0.004 | 0.3309 | No | ||
| 14 | NUP188 | 15053 | 12183 | -0.005 | 0.3080 | No | ||
| 15 | RAE1 | 12395 | 14822 | -0.017 | 0.1675 | No | ||
| 16 | RANBP2 | 20019 | 15939 | -0.043 | 0.1109 | No | ||
| 17 | NUP107 | 8337 | 16582 | -0.082 | 0.0829 | No | ||
| 18 | NUPL2 | 6072 | 16771 | -0.100 | 0.0808 | No | ||
| 19 | NUP93 | 7762 | 17622 | -0.230 | 0.0534 | No |