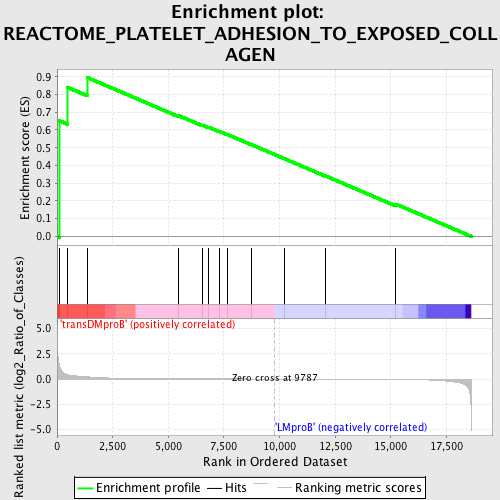
Profile of the Running ES Score & Positions of GeneSet Members on the Rank Ordered List
| Dataset | Set_04_transDMproB_versus_LMproB.phenotype_transDMproB_versus_LMproB.cls #transDMproB_versus_LMproB |
| Phenotype | phenotype_transDMproB_versus_LMproB.cls#transDMproB_versus_LMproB |
| Upregulated in class | transDMproB |
| GeneSet | REACTOME_PLATELET_ADHESION_TO_EXPOSED_COLLAGEN |
| Enrichment Score (ES) | 0.89536834 |
| Normalized Enrichment Score (NES) | 1.4381897 |
| Nominal p-value | 0.03958692 |
| FDR q-value | 0.84719807 |
| FWER p-Value | 1.0 |
| PROBE | DESCRIPTION (from dataset) | GENE SYMBOL | GENE_TITLE | RANK IN GENE LIST | RANK METRIC SCORE | RUNNING ES | CORE ENRICHMENT | |
|---|---|---|---|---|---|---|---|---|
| 1 | FCER1G | 13759 | 108 | 1.383 | 0.6515 | Yes | ||
| 2 | GP5 | 22616 | 462 | 0.438 | 0.8408 | Yes | ||
| 3 | ITGB1 | 3872 18411 | 1364 | 0.217 | 0.8954 | Yes | ||
| 4 | FYN | 3375 3395 20052 | 5437 | 0.012 | 0.6824 | No | ||
| 5 | CD36 | 8712 | 6537 | 0.007 | 0.6269 | No | ||
| 6 | GP9 | 17374 | 6786 | 0.007 | 0.6167 | No | ||
| 7 | LYN | 16281 | 7301 | 0.005 | 0.5915 | No | ||
| 8 | GP1BB | 9031 | 7661 | 0.004 | 0.5743 | No | ||
| 9 | COL1A2 | 8772 | 8720 | 0.002 | 0.5183 | No | ||
| 10 | GP1BA | 13683 | 10241 | -0.001 | 0.4371 | No | ||
| 11 | COL1A1 | 8771 | 12043 | -0.005 | 0.3424 | No | ||
| 12 | VWF | 17277 | 15220 | -0.023 | 0.1825 | No |

