Profile of the Running ES Score & Positions of GeneSet Members on the Rank Ordered List
| Dataset | Set_04_transDMproB_versus_LMproB.phenotype_transDMproB_versus_LMproB.cls #transDMproB_versus_LMproB |
| Phenotype | phenotype_transDMproB_versus_LMproB.cls#transDMproB_versus_LMproB |
| Upregulated in class | LMproB |
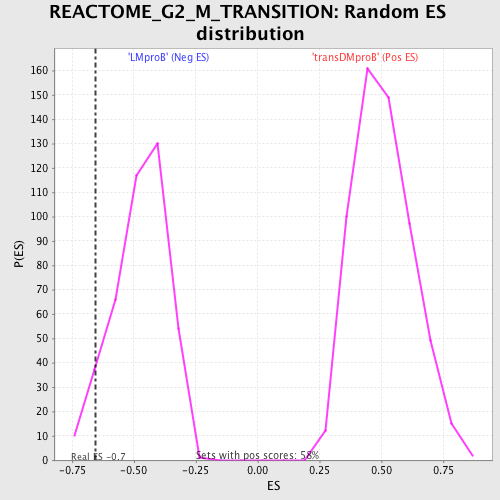
| GeneSet | REACTOME_G2_M_TRANSITION |
| Enrichment Score (ES) | -0.65449005 |
| Normalized Enrichment Score (NES) | -1.376281 |
| Nominal p-value | 0.060240965 |
| FDR q-value | 1.0 |
| FWER p-Value | 1.0 |
| PROBE | DESCRIPTION (from dataset) | GENE SYMBOL | GENE_TITLE | RANK IN GENE LIST | RANK METRIC SCORE | RUNNING ES | CORE ENRICHMENT | |
|---|---|---|---|---|---|---|---|---|
| 1 | DYNLL1 | 12135 | 287 | 0.587 | 0.0413 | No | ||
| 2 | CETN2 | 24138 | 795 | 0.317 | 0.0447 | No | ||
| 3 | CCNA2 | 15357 | 939 | 0.289 | 0.0650 | No | ||
| 4 | YWHAE | 20776 | 986 | 0.281 | 0.0897 | No | ||
| 5 | CCNB1 | 11201 21362 | 987 | 0.280 | 0.1168 | No | ||
| 6 | CCNH | 7322 | 1507 | 0.195 | 0.1077 | No | ||
| 7 | PPP2R1A | 11951 | 2184 | 0.115 | 0.0824 | No | ||
| 8 | TUBA4A | 10232 | 2254 | 0.108 | 0.0891 | No | ||
| 9 | MNAT1 | 9396 2161 | 3400 | 0.042 | 0.0316 | No | ||
| 10 | HSP90AA1 | 4883 4882 9131 | 4705 | 0.018 | -0.0369 | No | ||
| 11 | TUBB4 | 22917 | 5299 | 0.013 | -0.0676 | No | ||
| 12 | PRKACA | 18549 3844 | 7561 | 0.005 | -0.1889 | No | ||
| 13 | NEK2 | 5160 | 7735 | 0.004 | -0.1978 | No | ||
| 14 | WEE1 | 18127 | 8265 | 0.003 | -0.2260 | No | ||
| 15 | CCNA1 | 15340 | 8886 | 0.002 | -0.2592 | No | ||
| 16 | PLK4 | 1870 1874 | 10855 | -0.002 | -0.3650 | No | ||
| 17 | CDK7 | 21365 | 11315 | -0.003 | -0.3894 | No | ||
| 18 | XPO1 | 4172 | 11397 | -0.003 | -0.3935 | No | ||
| 19 | ODF2 | 9501 5205 2862 2949 | 12236 | -0.005 | -0.4381 | No | ||
| 20 | SDCCAG8 | 14034 | 12268 | -0.005 | -0.4393 | No | ||
| 21 | PRKAR2B | 5288 2107 | 12592 | -0.006 | -0.4561 | No | ||
| 22 | CDC25C | 23468 1954 1977 | 12842 | -0.007 | -0.4689 | No | ||
| 23 | CCNB2 | 19067 | 12969 | -0.007 | -0.4750 | No | ||
| 24 | PLK1 | 9590 5266 | 13525 | -0.009 | -0.5040 | No | ||
| 25 | OFD1 | 24007 | 13582 | -0.009 | -0.5061 | No | ||
| 26 | PCM1 | 3780 5229 | 13988 | -0.011 | -0.5268 | No | ||
| 27 | TUBA1A | 1130 10233 5807 5806 | 14953 | -0.019 | -0.5769 | No | ||
| 28 | FGFR1OP | 23391 | 15302 | -0.024 | -0.5933 | No | ||
| 29 | CLASP1 | 14159 | 15839 | -0.039 | -0.6184 | No | ||
| 30 | DCTN3 | 15908 | 16279 | -0.060 | -0.6362 | No | ||
| 31 | YWHAG | 16339 | 16425 | -0.070 | -0.6372 | No | ||
| 32 | SSNA1 | 4 | 16747 | -0.098 | -0.6450 | Yes | ||
| 33 | MAPRE1 | 4652 | 16751 | -0.098 | -0.6357 | Yes | ||
| 34 | CDC25B | 14841 | 16984 | -0.124 | -0.6362 | Yes | ||
| 35 | CSNK1D | 4181 8352 1387 | 16987 | -0.124 | -0.6243 | Yes | ||
| 36 | CSNK1E | 6570 2211 11332 | 16988 | -0.124 | -0.6123 | Yes | ||
| 37 | DYNC1H1 | 8856 | 17249 | -0.161 | -0.6107 | Yes | ||
| 38 | CDC25A | 8721 | 17457 | -0.198 | -0.6027 | Yes | ||
| 39 | ACTR1A | 23653 | 17834 | -0.281 | -0.5957 | Yes | ||
| 40 | NUMA1 | 18167 | 18244 | -0.471 | -0.5722 | Yes | ||
| 41 | PCNT | 19724 | 18268 | -0.488 | -0.5262 | Yes | ||
| 42 | TUBG1 | 20662 | 18287 | -0.506 | -0.4783 | Yes | ||
| 43 | PAFAH1B1 | 1340 5220 9524 | 18559 | -1.441 | -0.3534 | Yes | ||
| 44 | DCTN2 | 7635 12812 | 18612 | -3.684 | 0.0002 | Yes |