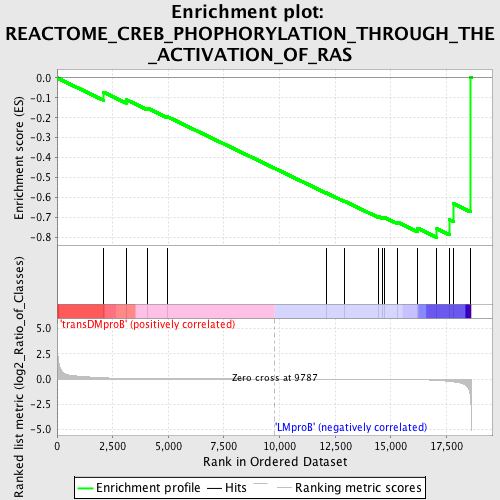
Profile of the Running ES Score & Positions of GeneSet Members on the Rank Ordered List
| Dataset | Set_04_transDMproB_versus_LMproB.phenotype_transDMproB_versus_LMproB.cls #transDMproB_versus_LMproB |
| Phenotype | phenotype_transDMproB_versus_LMproB.cls#transDMproB_versus_LMproB |
| Upregulated in class | LMproB |
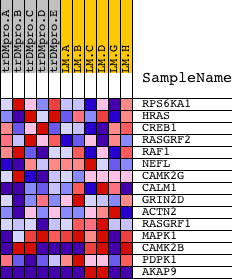
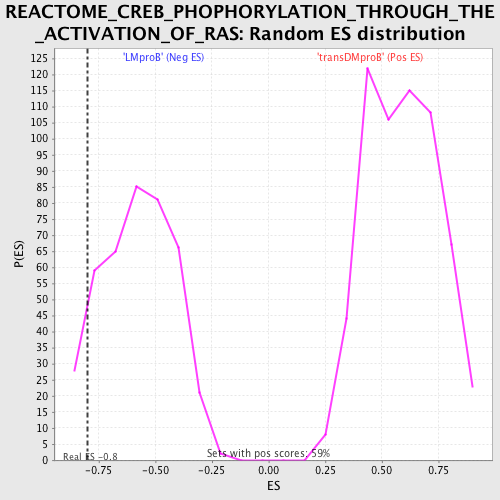
| GeneSet | REACTOME_CREB_PHOPHORYLATION_THROUGH_THE_ACTIVATION_OF_RAS |
| Enrichment Score (ES) | -0.80117244 |
| Normalized Enrichment Score (NES) | -1.3871061 |
| Nominal p-value | 0.07862408 |
| FDR q-value | 1.0 |
| FWER p-Value | 1.0 |
| PROBE | DESCRIPTION (from dataset) | GENE SYMBOL | GENE_TITLE | RANK IN GENE LIST | RANK METRIC SCORE | RUNNING ES | CORE ENRICHMENT | |
|---|---|---|---|---|---|---|---|---|
| 1 | RPS6KA1 | 15725 | 2073 | 0.125 | -0.0710 | No | ||
| 2 | HRAS | 4868 | 3102 | 0.053 | -0.1089 | No | ||
| 3 | CREB1 | 3990 8782 4558 4093 | 4065 | 0.026 | -0.1521 | No | ||
| 4 | RASGRF2 | 21397 | 4946 | 0.016 | -0.1944 | No | ||
| 5 | RAF1 | 17035 | 12094 | -0.005 | -0.5771 | No | ||
| 6 | NEFL | 9459 | 12909 | -0.007 | -0.6186 | No | ||
| 7 | CAMK2G | 21905 | 14433 | -0.014 | -0.6960 | No | ||
| 8 | CALM1 | 21184 | 14639 | -0.015 | -0.7020 | No | ||
| 9 | GRIN2D | 9042 | 14730 | -0.016 | -0.7016 | No | ||
| 10 | ACTN2 | 21545 | 15303 | -0.024 | -0.7245 | No | ||
| 11 | RASGRF1 | 3050 19357 | 16205 | -0.056 | -0.7548 | No | ||
| 12 | MAPK1 | 1642 11167 | 17069 | -0.135 | -0.7574 | Yes | ||
| 13 | CAMK2B | 20536 | 17631 | -0.233 | -0.7120 | Yes | ||
| 14 | PDPK1 | 23097 | 17824 | -0.278 | -0.6321 | Yes | ||
| 15 | AKAP9 | 16604 16603 4150 8303 | 18585 | -2.077 | 0.0017 | Yes |