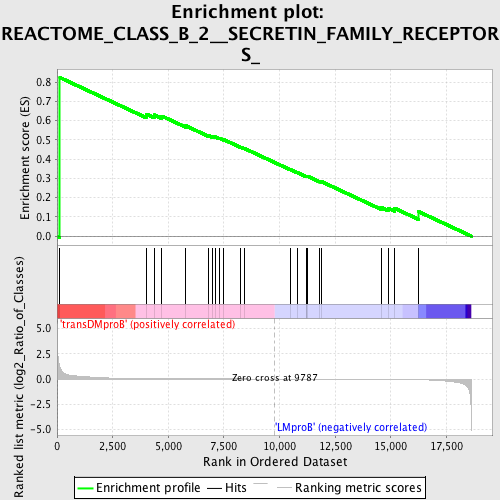
Profile of the Running ES Score & Positions of GeneSet Members on the Rank Ordered List
| Dataset | Set_04_transDMproB_versus_LMproB.phenotype_transDMproB_versus_LMproB.cls #transDMproB_versus_LMproB |
| Phenotype | phenotype_transDMproB_versus_LMproB.cls#transDMproB_versus_LMproB |
| Upregulated in class | transDMproB |
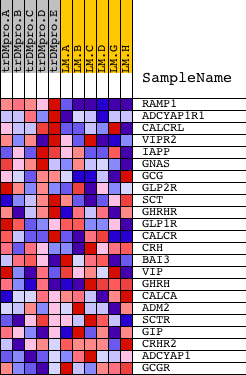
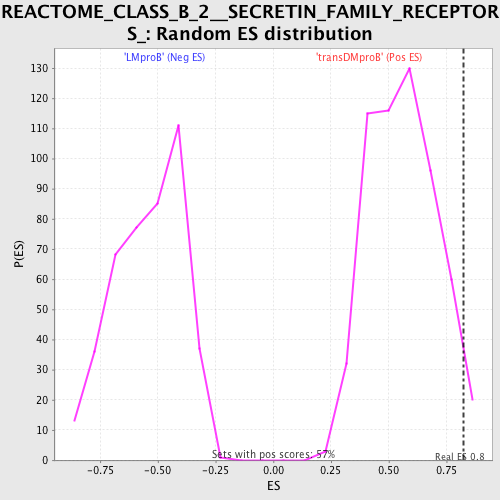
| GeneSet | REACTOME_CLASS_B_2__SECRETIN_FAMILY_RECEPTORS_ |
| Enrichment Score (ES) | 0.8237155 |
| Normalized Enrichment Score (NES) | 1.4683055 |
| Nominal p-value | 0.02972028 |
| FDR q-value | 0.67897147 |
| FWER p-Value | 1.0 |
| PROBE | DESCRIPTION (from dataset) | GENE SYMBOL | GENE_TITLE | RANK IN GENE LIST | RANK METRIC SCORE | RUNNING ES | CORE ENRICHMENT | |
|---|---|---|---|---|---|---|---|---|
| 1 | RAMP1 | 14189 | 127 | 1.191 | 0.8237 | Yes | ||
| 2 | ADCYAP1R1 | 8553 1192 4349 | 4005 | 0.027 | 0.6342 | No | ||
| 3 | CALCRL | 12041 | 4364 | 0.021 | 0.6297 | No | ||
| 4 | VIPR2 | 21125 | 4700 | 0.018 | 0.6242 | No | ||
| 5 | IAPP | 17249 | 5792 | 0.011 | 0.5728 | No | ||
| 6 | GNAS | 9025 2963 2752 | 6792 | 0.007 | 0.5237 | No | ||
| 7 | GCG | 14578 | 6990 | 0.006 | 0.5174 | No | ||
| 8 | GLP2R | 8227 13563 13564 | 7100 | 0.006 | 0.5155 | No | ||
| 9 | SCT | 17560 | 7295 | 0.005 | 0.5087 | No | ||
| 10 | GHRHR | 1007 17436 | 7495 | 0.005 | 0.5013 | No | ||
| 11 | GLP1R | 23304 | 8259 | 0.003 | 0.4623 | No | ||
| 12 | CALCR | 17229 | 8403 | 0.003 | 0.4564 | No | ||
| 13 | CRH | 8784 | 10491 | -0.001 | 0.3451 | No | ||
| 14 | BAI3 | 5580 | 10795 | -0.002 | 0.3301 | No | ||
| 15 | VIP | 20096 | 11190 | -0.003 | 0.3108 | No | ||
| 16 | GHRH | 14372 | 11204 | -0.003 | 0.3120 | No | ||
| 17 | CALCA | 4470 | 11256 | -0.003 | 0.3112 | No | ||
| 18 | ADM2 | 22388 | 11814 | -0.004 | 0.2840 | No | ||
| 19 | SCTR | 14157 | 11886 | -0.004 | 0.2831 | No | ||
| 20 | GIP | 76 | 14583 | -0.015 | 0.1485 | No | ||
| 21 | CRHR2 | 17140 | 14884 | -0.018 | 0.1448 | No | ||
| 22 | ADCYAP1 | 4348 | 15164 | -0.022 | 0.1451 | No | ||
| 23 | GCGR | 20566 | 16246 | -0.058 | 0.1275 | No |