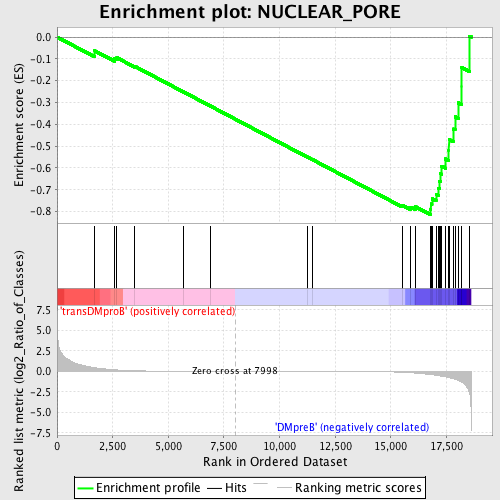
Profile of the Running ES Score & Positions of GeneSet Members on the Rank Ordered List
| Dataset | Set_04_transDMproB_versus_DMpreB.phenotype_transDMproB_versus_DMpreB.cls #transDMproB_versus_DMpreB.phenotype_transDMproB_versus_DMpreB.cls #transDMproB_versus_DMpreB_repos |
| Phenotype | phenotype_transDMproB_versus_DMpreB.cls#transDMproB_versus_DMpreB_repos |
| Upregulated in class | DMpreB |
| GeneSet | NUCLEAR_PORE |
| Enrichment Score (ES) | -0.81330365 |
| Normalized Enrichment Score (NES) | -1.5648459 |
| Nominal p-value | 0.0041237115 |
| FDR q-value | 0.11360723 |
| FWER p-Value | 0.804 |

| PROBE | DESCRIPTION (from dataset) | GENE SYMBOL | GENE_TITLE | RANK IN GENE LIST | RANK METRIC SCORE | RUNNING ES | CORE ENRICHMENT | |
|---|---|---|---|---|---|---|---|---|
| 1 | SENP2 | 7990 | 1694 | 0.437 | -0.0633 | No | ||
| 2 | HRB | 14208 4066 | 2573 | 0.186 | -0.0987 | No | ||
| 3 | NUP54 | 11231 11232 6516 | 2686 | 0.159 | -0.0947 | No | ||
| 4 | RANGAP1 | 2180 22195 | 3494 | 0.060 | -0.1343 | No | ||
| 5 | NUP153 | 21474 | 5687 | 0.007 | -0.2517 | No | ||
| 6 | TPR | 927 4255 | 6880 | 0.003 | -0.3157 | No | ||
| 7 | IPO7 | 6130 | 11238 | -0.009 | -0.5495 | No | ||
| 8 | NUP50 | 22403 9478 22402 2168 | 11477 | -0.010 | -0.5617 | No | ||
| 9 | NUP98 | 17726 | 15505 | -0.121 | -0.7706 | No | ||
| 10 | NUP62 | 9497 | 15877 | -0.178 | -0.7792 | No | ||
| 11 | RANBP2 | 20019 | 16117 | -0.220 | -0.7781 | No | ||
| 12 | KPNA3 | 21797 | 16772 | -0.390 | -0.7885 | Yes | ||
| 13 | NXT1 | 14814 | 16805 | -0.399 | -0.7648 | Yes | ||
| 14 | XPO7 | 12272 7239 | 16851 | -0.414 | -0.7409 | Yes | ||
| 15 | NUTF2 | 12632 7529 | 17037 | -0.483 | -0.7201 | Yes | ||
| 16 | NUP88 | 20365 1316 | 17148 | -0.528 | -0.6925 | Yes | ||
| 17 | KPNA1 | 22776 | 17193 | -0.547 | -0.6601 | Yes | ||
| 18 | SUMO1 | 5826 3943 10247 | 17223 | -0.561 | -0.6260 | Yes | ||
| 19 | DDX19B | 8888 | 17268 | -0.584 | -0.5912 | Yes | ||
| 20 | NUP160 | 14957 | 17457 | -0.672 | -0.5586 | Yes | ||
| 21 | NUP107 | 8337 | 17608 | -0.765 | -0.5180 | Yes | ||
| 22 | SNUPN | 12282 | 17614 | -0.769 | -0.4693 | Yes | ||
| 23 | RAE1 | 12395 | 17803 | -0.914 | -0.4213 | Yes | ||
| 24 | KPNB1 | 20274 | 17890 | -0.960 | -0.3649 | Yes | ||
| 25 | RANBP5 | 21930 | 18034 | -1.116 | -0.3016 | Yes | ||
| 26 | EIF5A | 11345 20379 6590 | 18187 | -1.340 | -0.2246 | Yes | ||
| 27 | AAAS | 22111 2274 | 18188 | -1.341 | -0.1393 | Yes | ||
| 28 | NUP133 | 3849 18714 | 18534 | -2.551 | 0.0044 | Yes |

