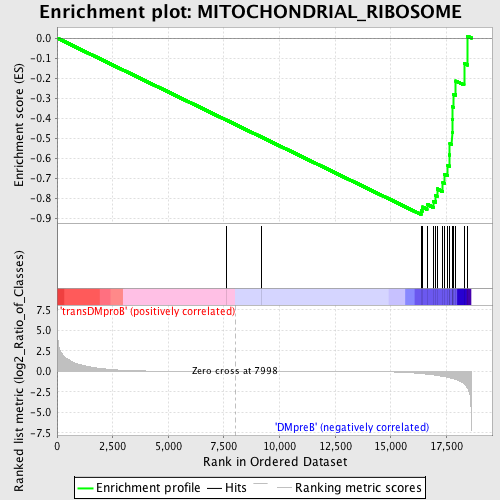
Profile of the Running ES Score & Positions of GeneSet Members on the Rank Ordered List
| Dataset | Set_04_transDMproB_versus_DMpreB.phenotype_transDMproB_versus_DMpreB.cls #transDMproB_versus_DMpreB.phenotype_transDMproB_versus_DMpreB.cls #transDMproB_versus_DMpreB_repos |
| Phenotype | phenotype_transDMproB_versus_DMpreB.cls#transDMproB_versus_DMpreB_repos |
| Upregulated in class | DMpreB |
| GeneSet | MITOCHONDRIAL_RIBOSOME |
| Enrichment Score (ES) | -0.8793923 |
| Normalized Enrichment Score (NES) | -1.5779188 |
| Nominal p-value | 0.0 |
| FDR q-value | 0.121030025 |
| FWER p-Value | 0.718 |
| PROBE | DESCRIPTION (from dataset) | GENE SYMBOL | GENE_TITLE | RANK IN GENE LIST | RANK METRIC SCORE | RUNNING ES | CORE ENRICHMENT | |
|---|---|---|---|---|---|---|---|---|
| 1 | MRPS22 | 19031 | 7629 | 0.001 | -0.4102 | No | ||
| 2 | MRPS36 | 7257 | 9202 | -0.003 | -0.4945 | No | ||
| 3 | MRPS16 | 12311 | 16361 | -0.274 | -0.8599 | Yes | ||
| 4 | MRPS21 | 12323 | 16407 | -0.285 | -0.8419 | Yes | ||
| 5 | MRPL51 | 12361 7301 | 16628 | -0.348 | -0.8289 | Yes | ||
| 6 | MRPS18C | 12728 | 16912 | -0.441 | -0.8127 | Yes | ||
| 7 | MRPL23 | 9738 | 17013 | -0.476 | -0.7841 | Yes | ||
| 8 | MRPS35 | 17237 1068 | 17081 | -0.502 | -0.7520 | Yes | ||
| 9 | MRPS15 | 2442 12345 | 17339 | -0.615 | -0.7219 | Yes | ||
| 10 | MRPL10 | 20681 | 17406 | -0.648 | -0.6793 | Yes | ||
| 11 | MRPL52 | 22019 | 17561 | -0.741 | -0.6347 | Yes | ||
| 12 | MRPS24 | 12262 | 17643 | -0.792 | -0.5826 | Yes | ||
| 13 | MRPL40 | 22641 | 17655 | -0.805 | -0.5258 | Yes | ||
| 14 | MRPS12 | 17907 6273 | 17749 | -0.873 | -0.4685 | Yes | ||
| 15 | MRPL55 | 20864 | 17759 | -0.886 | -0.4058 | Yes | ||
| 16 | MRPS28 | 15377 | 17774 | -0.896 | -0.3426 | Yes | ||
| 17 | MRPS11 | 12621 3150 | 17825 | -0.925 | -0.2794 | Yes | ||
| 18 | MRPS18A | 23222 | 17922 | -0.989 | -0.2140 | Yes | ||
| 19 | MRPL12 | 12090 | 18290 | -1.500 | -0.1267 | Yes | ||
| 20 | MRPS10 | 7229 12261 23212 | 18436 | -2.022 | 0.0097 | Yes |

