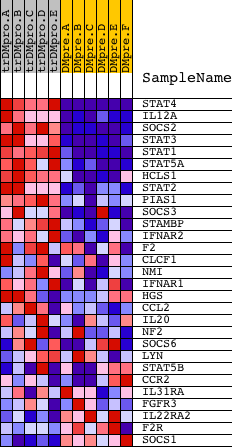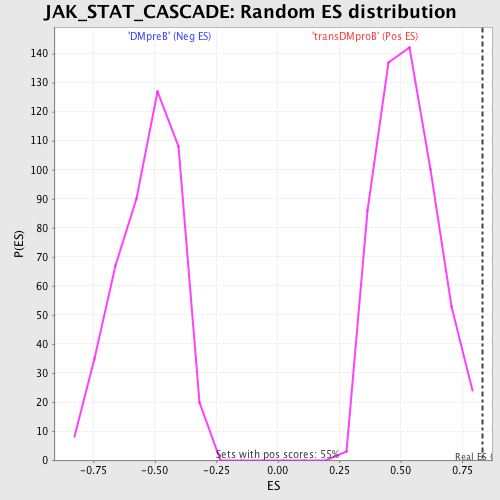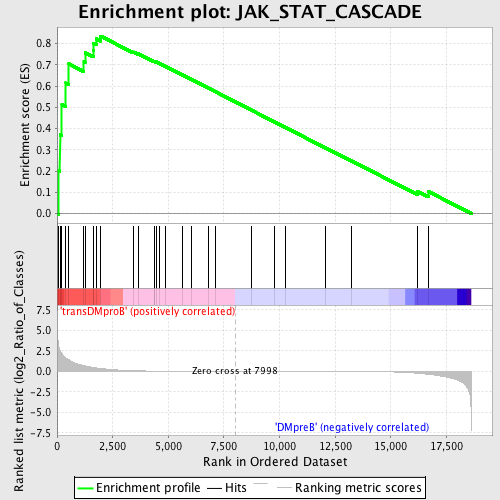
Profile of the Running ES Score & Positions of GeneSet Members on the Rank Ordered List
| Dataset | Set_04_transDMproB_versus_DMpreB.phenotype_transDMproB_versus_DMpreB.cls #transDMproB_versus_DMpreB.phenotype_transDMproB_versus_DMpreB.cls #transDMproB_versus_DMpreB_repos |
| Phenotype | phenotype_transDMproB_versus_DMpreB.cls#transDMproB_versus_DMpreB_repos |
| Upregulated in class | transDMproB |
| GeneSet | JAK_STAT_CASCADE |
| Enrichment Score (ES) | 0.83500344 |
| Normalized Enrichment Score (NES) | 1.5831558 |
| Nominal p-value | 0.0 |
| FDR q-value | 0.24052742 |
| FWER p-Value | 0.605 |
| PROBE | DESCRIPTION (from dataset) | GENE SYMBOL | GENE_TITLE | RANK IN GENE LIST | RANK METRIC SCORE | RUNNING ES | CORE ENRICHMENT | |
|---|---|---|---|---|---|---|---|---|
| 1 | STAT4 | 14251 9907 | 80 | 2.977 | 0.2011 | Yes | ||
| 2 | IL12A | 4913 | 129 | 2.506 | 0.3713 | Yes | ||
| 3 | SOCS2 | 5694 | 217 | 2.127 | 0.5134 | Yes | ||
| 4 | STAT3 | 5525 9906 | 396 | 1.605 | 0.6145 | Yes | ||
| 5 | STAT1 | 3936 5524 | 531 | 1.404 | 0.7042 | Yes | ||
| 6 | STAT5A | 20664 | 1207 | 0.676 | 0.7145 | Yes | ||
| 7 | HCLS1 | 22770 | 1257 | 0.651 | 0.7568 | Yes | ||
| 8 | STAT2 | 19840 | 1624 | 0.469 | 0.7694 | Yes | ||
| 9 | PIAS1 | 7126 | 1633 | 0.464 | 0.8010 | Yes | ||
| 10 | SOCS3 | 20131 | 1763 | 0.406 | 0.8221 | Yes | ||
| 11 | STAMBP | 17097 | 1956 | 0.337 | 0.8350 | Yes | ||
| 12 | IFNAR2 | 22705 1699 | 3428 | 0.064 | 0.7603 | No | ||
| 13 | F2 | 14524 | 3648 | 0.049 | 0.7519 | No | ||
| 14 | CLCF1 | 12160 3742 | 4367 | 0.022 | 0.7148 | No | ||
| 15 | NMI | 14590 | 4389 | 0.021 | 0.7152 | No | ||
| 16 | IFNAR1 | 22703 | 4446 | 0.020 | 0.7135 | No | ||
| 17 | HGS | 20568 | 4609 | 0.017 | 0.7060 | No | ||
| 18 | CCL2 | 9788 | 4864 | 0.013 | 0.6932 | No | ||
| 19 | IL20 | 13840 | 5643 | 0.007 | 0.6519 | No | ||
| 20 | NF2 | 1222 5166 | 6031 | 0.006 | 0.6315 | No | ||
| 21 | SOCS6 | 12042 7044 | 6792 | 0.003 | 0.5908 | No | ||
| 22 | LYN | 16281 | 7120 | 0.002 | 0.5733 | No | ||
| 23 | STAT5B | 20222 | 8729 | -0.002 | 0.4870 | No | ||
| 24 | CCR2 | 19250 | 9757 | -0.004 | 0.4320 | No | ||
| 25 | IL31RA | 21347 | 10272 | -0.006 | 0.4047 | No | ||
| 26 | FGFR3 | 8969 3566 | 12054 | -0.013 | 0.3098 | No | ||
| 27 | IL22RA2 | 20082 | 13215 | -0.023 | 0.2490 | No | ||
| 28 | F2R | 21386 | 16204 | -0.237 | 0.1046 | No | ||
| 29 | SOCS1 | 4522 | 16690 | -0.364 | 0.1036 | No |