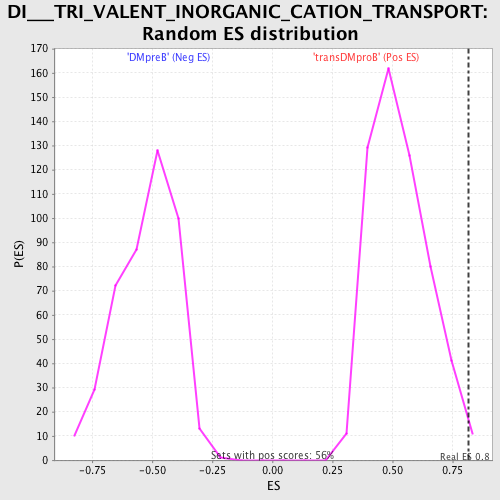
Profile of the Running ES Score & Positions of GeneSet Members on the Rank Ordered List
| Dataset | Set_04_transDMproB_versus_DMpreB.phenotype_transDMproB_versus_DMpreB.cls #transDMproB_versus_DMpreB.phenotype_transDMproB_versus_DMpreB.cls #transDMproB_versus_DMpreB_repos |
| Phenotype | phenotype_transDMproB_versus_DMpreB.cls#transDMproB_versus_DMpreB_repos |
| Upregulated in class | transDMproB |
| GeneSet | DI___TRI_VALENT_INORGANIC_CATION_TRANSPORT |
| Enrichment Score (ES) | 0.8148834 |
| Normalized Enrichment Score (NES) | 1.5363959 |
| Nominal p-value | 0.008928572 |
| FDR q-value | 0.27777115 |
| FWER p-Value | 0.934 |
| PROBE | DESCRIPTION (from dataset) | GENE SYMBOL | GENE_TITLE | RANK IN GENE LIST | RANK METRIC SCORE | RUNNING ES | CORE ENRICHMENT | |
|---|---|---|---|---|---|---|---|---|
| 1 | ATP2A3 | 20795 1314 | 0 | 7.336 | 0.5600 | Yes | ||
| 2 | SLC30A5 | 3190 21361 | 489 | 1.462 | 0.6453 | Yes | ||
| 3 | CACNA2D1 | 8676 | 546 | 1.366 | 0.7465 | Yes | ||
| 4 | SLC40A1 | 13964 | 815 | 0.979 | 0.8068 | Yes | ||
| 5 | STIM1 | 18164 | 1447 | 0.550 | 0.8149 | Yes | ||
| 6 | SLC39A1 | 6625 | 2673 | 0.161 | 0.7613 | No | ||
| 7 | ATP2C1 | 10660 6178 | 2825 | 0.133 | 0.7634 | No | ||
| 8 | SLC11A2 | 22130 | 2840 | 0.131 | 0.7726 | No | ||
| 9 | HFE | 21519 | 3411 | 0.066 | 0.7469 | No | ||
| 10 | ATP2A1 | 17639 | 3961 | 0.034 | 0.7200 | No | ||
| 11 | CCL8 | 20740 | 4765 | 0.014 | 0.6779 | No | ||
| 12 | PLN | 20026 | 5125 | 0.011 | 0.6594 | No | ||
| 13 | NMUR1 | 13898 | 5253 | 0.010 | 0.6534 | No | ||
| 14 | TRPC4 | 15593 | 5947 | 0.006 | 0.6165 | No | ||
| 15 | CACNA1D | 4464 8675 | 6392 | 0.004 | 0.5930 | No | ||
| 16 | TRPC3 | 15355 | 6454 | 0.004 | 0.5900 | No | ||
| 17 | NPY | 17449 | 8047 | -0.000 | 0.5044 | No | ||
| 18 | SLN | 19450 | 8815 | -0.002 | 0.4633 | No | ||
| 19 | TRPM2 | 19717 | 9983 | -0.005 | 0.4009 | No | ||
| 20 | CACNB3 | 22373 8679 | 10777 | -0.007 | 0.3588 | No | ||
| 21 | CHRNA7 | 17808 | 11963 | -0.012 | 0.2960 | No | ||
| 22 | TRPC5 | 24039 | 12122 | -0.013 | 0.2885 | No | ||
| 23 | CACNB4 | 4467 | 12626 | -0.017 | 0.2628 | No | ||
| 24 | RYR3 | 14486 | 12938 | -0.020 | 0.2476 | No | ||
| 25 | TRPC1 | 2984 19039 | 13295 | -0.024 | 0.2303 | No | ||
| 26 | RYR1 | 17903 17902 9770 | 14943 | -0.072 | 0.1471 | No | ||
| 27 | NMUR2 | 20443 | 15438 | -0.114 | 0.1292 | No | ||
| 28 | SLC8A1 | 9830 | 17189 | -0.546 | 0.0768 | No |