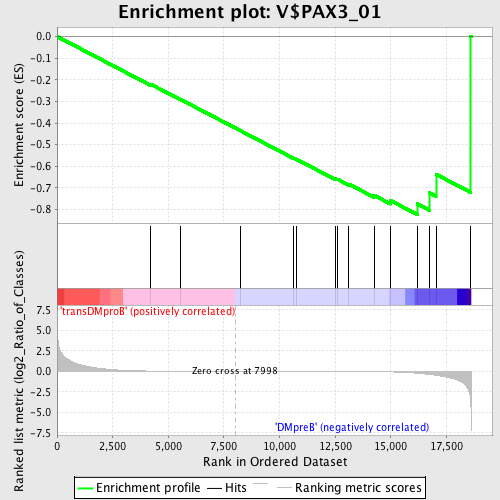
Profile of the Running ES Score & Positions of GeneSet Members on the Rank Ordered List
| Dataset | Set_04_transDMproB_versus_DMpreB.phenotype_transDMproB_versus_DMpreB.cls #transDMproB_versus_DMpreB.phenotype_transDMproB_versus_DMpreB.cls #transDMproB_versus_DMpreB_repos |
| Phenotype | phenotype_transDMproB_versus_DMpreB.cls#transDMproB_versus_DMpreB_repos |
| Upregulated in class | DMpreB |
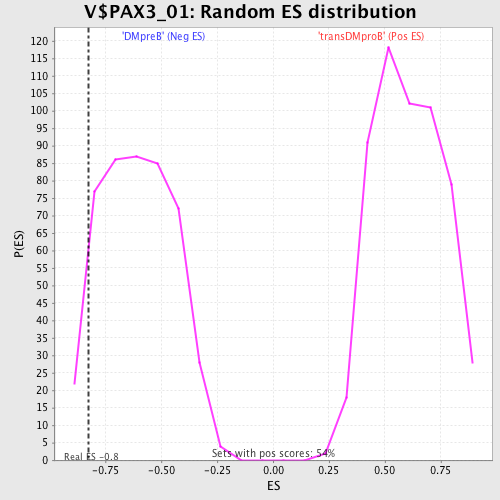
| GeneSet | V$PAX3_01 |
| Enrichment Score (ES) | -0.82302105 |
| Normalized Enrichment Score (NES) | -1.3632001 |
| Nominal p-value | 0.06507592 |
| FDR q-value | 0.7216912 |
| FWER p-Value | 0.999 |
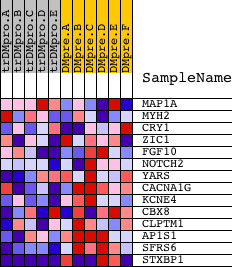
| PROBE | DESCRIPTION (from dataset) | GENE SYMBOL | GENE_TITLE | RANK IN GENE LIST | RANK METRIC SCORE | RUNNING ES | CORE ENRICHMENT | |
|---|---|---|---|---|---|---|---|---|
| 1 | MAP1A | 5124 | 4197 | 0.026 | -0.2200 | No | ||
| 2 | MYH2 | 20838 | 5562 | 0.008 | -0.2917 | No | ||
| 3 | CRY1 | 19662 | 8260 | -0.001 | -0.4366 | No | ||
| 4 | ZIC1 | 19040 | 10643 | -0.007 | -0.5632 | No | ||
| 5 | FGF10 | 4719 8962 | 10747 | -0.007 | -0.5672 | No | ||
| 6 | NOTCH2 | 15485 | 12491 | -0.016 | -0.6575 | No | ||
| 7 | YARS | 16071 | 12601 | -0.017 | -0.6597 | No | ||
| 8 | CACNA1G | 1237 940 20292 | 13112 | -0.022 | -0.6825 | No | ||
| 9 | KCNE4 | 12196 | 14245 | -0.042 | -0.7344 | No | ||
| 10 | CBX8 | 11401 | 14993 | -0.074 | -0.7589 | No | ||
| 11 | CLPTM1 | 17940 | 16186 | -0.233 | -0.7739 | Yes | ||
| 12 | AP1S1 | 3500 3453 16335 | 16752 | -0.385 | -0.7232 | Yes | ||
| 13 | SFRS6 | 14751 | 17031 | -0.480 | -0.6371 | Yes | ||
| 14 | STXBP1 | 2818 9930 | 18582 | -3.429 | 0.0018 | Yes |