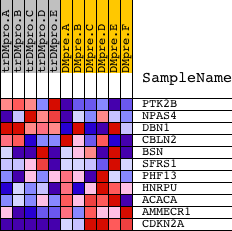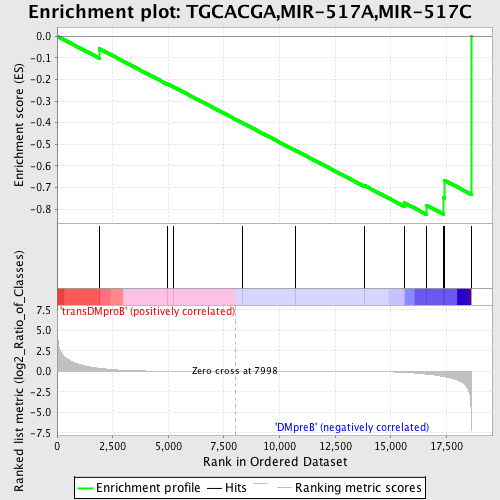
Profile of the Running ES Score & Positions of GeneSet Members on the Rank Ordered List
| Dataset | Set_04_transDMproB_versus_DMpreB.phenotype_transDMproB_versus_DMpreB.cls #transDMproB_versus_DMpreB.phenotype_transDMproB_versus_DMpreB.cls #transDMproB_versus_DMpreB_repos |
| Phenotype | phenotype_transDMproB_versus_DMpreB.cls#transDMproB_versus_DMpreB_repos |
| Upregulated in class | DMpreB |
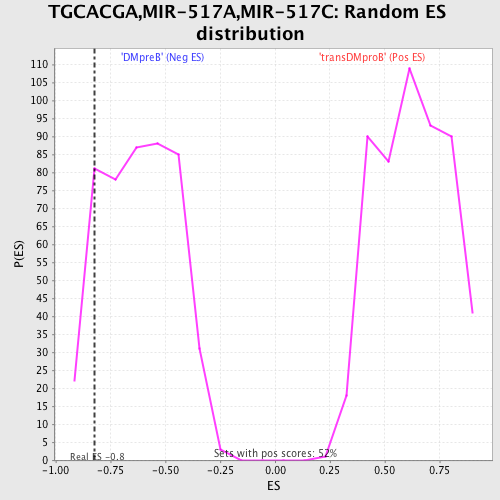
| GeneSet | TGCACGA,MIR-517A,MIR-517C |
| Enrichment Score (ES) | -0.8241671 |
| Normalized Enrichment Score (NES) | -1.3402362 |
| Nominal p-value | 0.10947368 |
| FDR q-value | 0.7233739 |
| FWER p-Value | 1.0 |
| PROBE | DESCRIPTION (from dataset) | GENE SYMBOL | GENE_TITLE | RANK IN GENE LIST | RANK METRIC SCORE | RUNNING ES | CORE ENRICHMENT | |
|---|---|---|---|---|---|---|---|---|
| 1 | PTK2B | 21776 | 1904 | 0.355 | -0.0586 | No | ||
| 2 | NPAS4 | 23970 3683 | 4948 | 0.013 | -0.2206 | No | ||
| 3 | DBN1 | 21452 | 5223 | 0.010 | -0.2341 | No | ||
| 4 | CBLN2 | 23498 | 8354 | -0.001 | -0.4022 | No | ||
| 5 | BSN | 18997 | 10731 | -0.007 | -0.5290 | No | ||
| 6 | SFRS1 | 8492 | 13823 | -0.033 | -0.6911 | No | ||
| 7 | PHF13 | 15659 | 15616 | -0.135 | -0.7707 | No | ||
| 8 | HNRPU | 6959 | 16611 | -0.343 | -0.7820 | Yes | ||
| 9 | ACACA | 309 4209 | 17370 | -0.627 | -0.7455 | Yes | ||
| 10 | AMMECR1 | 7067 | 17423 | -0.658 | -0.6671 | Yes | ||
| 11 | CDKN2A | 2491 15841 | 18612 | -5.935 | 0.0002 | Yes |