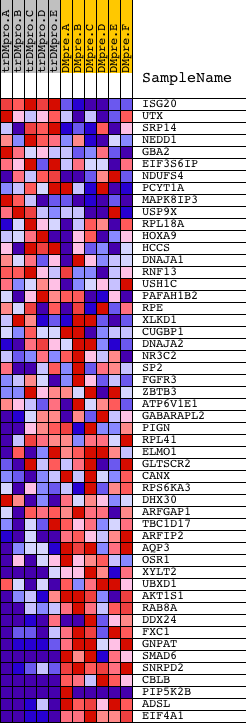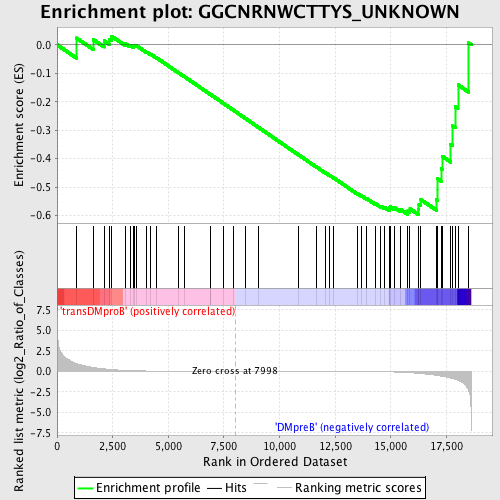
Profile of the Running ES Score & Positions of GeneSet Members on the Rank Ordered List
| Dataset | Set_04_transDMproB_versus_DMpreB.phenotype_transDMproB_versus_DMpreB.cls #transDMproB_versus_DMpreB.phenotype_transDMproB_versus_DMpreB.cls #transDMproB_versus_DMpreB_repos |
| Phenotype | phenotype_transDMproB_versus_DMpreB.cls#transDMproB_versus_DMpreB_repos |
| Upregulated in class | DMpreB |
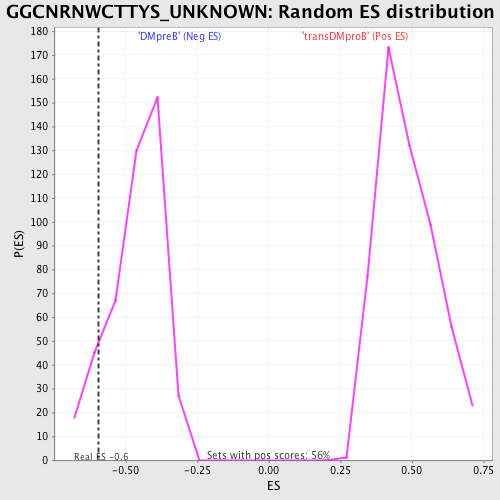
| GeneSet | GGCNRNWCTTYS_UNKNOWN |
| Enrichment Score (ES) | -0.5958871 |
| Normalized Enrichment Score (NES) | -1.2951691 |
| Nominal p-value | 0.10022779 |
| FDR q-value | 0.6183288 |
| FWER p-Value | 1.0 |
| PROBE | DESCRIPTION (from dataset) | GENE SYMBOL | GENE_TITLE | RANK IN GENE LIST | RANK METRIC SCORE | RUNNING ES | CORE ENRICHMENT | |
|---|---|---|---|---|---|---|---|---|
| 1 | ISG20 | 18210 | 869 | 0.933 | 0.0239 | No | ||
| 2 | UTX | 10266 2574 | 1640 | 0.462 | 0.0175 | No | ||
| 3 | SRP14 | 9894 | 2110 | 0.291 | 0.0143 | No | ||
| 4 | NEDD1 | 19643 | 2342 | 0.235 | 0.0197 | No | ||
| 5 | GBA2 | 15898 | 2443 | 0.213 | 0.0304 | No | ||
| 6 | EIF3S6IP | 22427 2301 | 3082 | 0.097 | 0.0034 | No | ||
| 7 | NDUFS4 | 9452 5157 3173 | 3285 | 0.077 | -0.0016 | No | ||
| 8 | PCYT1A | 4572 | 3432 | 0.064 | -0.0047 | No | ||
| 9 | MAPK8IP3 | 11402 23080 | 3458 | 0.062 | -0.0013 | No | ||
| 10 | USP9X | 10264 10265 5834 | 3574 | 0.054 | -0.0034 | No | ||
| 11 | RPL18A | 13358 | 4031 | 0.032 | -0.0256 | No | ||
| 12 | HOXA9 | 17147 9109 1024 | 4211 | 0.026 | -0.0332 | No | ||
| 13 | HCCS | 9079 4842 | 4459 | 0.020 | -0.0450 | No | ||
| 14 | DNAJA1 | 4878 16242 2345 | 5454 | 0.008 | -0.0979 | No | ||
| 15 | RNF13 | 6271 | 5710 | 0.007 | -0.1111 | No | ||
| 16 | USH1C | 1471 17821 | 6874 | 0.003 | -0.1735 | No | ||
| 17 | PAFAH1B2 | 5221 9525 | 6895 | 0.003 | -0.1744 | No | ||
| 18 | RPE | 14232 | 7464 | 0.001 | -0.2049 | No | ||
| 19 | XLKD1 | 17675 | 7929 | 0.000 | -0.2299 | No | ||
| 20 | CUGBP1 | 2805 8819 4576 2924 | 8484 | -0.001 | -0.2597 | No | ||
| 21 | DNAJA2 | 12133 18806 | 9035 | -0.002 | -0.2891 | No | ||
| 22 | NR3C2 | 18562 13798 | 10847 | -0.008 | -0.3861 | No | ||
| 23 | SP2 | 8130 | 11677 | -0.011 | -0.4299 | No | ||
| 24 | FGFR3 | 8969 3566 | 12054 | -0.013 | -0.4492 | No | ||
| 25 | ZBTB3 | 23941 | 12240 | -0.014 | -0.4581 | No | ||
| 26 | ATP6V1E1 | 4423 | 12441 | -0.016 | -0.4676 | No | ||
| 27 | GABARAPL2 | 8211 13552 | 13503 | -0.028 | -0.5227 | No | ||
| 28 | PIGN | 13865 | 13697 | -0.031 | -0.5307 | No | ||
| 29 | RPL41 | 12611 | 13922 | -0.035 | -0.5402 | No | ||
| 30 | ELMO1 | 3275 8939 3202 3271 3254 3235 3164 3175 3274 3188 3293 3214 3218 3239 | 14321 | -0.044 | -0.5583 | No | ||
| 31 | GLTSCR2 | 12639 | 14545 | -0.052 | -0.5663 | No | ||
| 32 | CANX | 4474 | 14714 | -0.060 | -0.5708 | No | ||
| 33 | RPS6KA3 | 8490 | 14937 | -0.071 | -0.5773 | No | ||
| 34 | DHX30 | 18989 | 14939 | -0.071 | -0.5720 | No | ||
| 35 | ARFGAP1 | 14705 2854 | 14983 | -0.074 | -0.5687 | No | ||
| 36 | TBC1D17 | 6121 | 15175 | -0.087 | -0.5724 | No | ||
| 37 | ARFIP2 | 1226 17702 | 15420 | -0.112 | -0.5770 | No | ||
| 38 | AQP3 | 15915 | 15761 | -0.155 | -0.5835 | Yes | ||
| 39 | OSR1 | 18971 | 15860 | -0.173 | -0.5757 | Yes | ||
| 40 | XYLT2 | 20288 | 16236 | -0.247 | -0.5771 | Yes | ||
| 41 | UBXD1 | 12370 1516 | 16263 | -0.252 | -0.5594 | Yes | ||
| 42 | AKT1S1 | 12557 | 16351 | -0.271 | -0.5435 | Yes | ||
| 43 | RAB8A | 9380 5091 | 17052 | -0.490 | -0.5440 | Yes | ||
| 44 | DDX24 | 2084 20995 | 17083 | -0.503 | -0.5075 | Yes | ||
| 45 | FXC1 | 8988 4043 | 17084 | -0.503 | -0.4694 | Yes | ||
| 46 | GNPAT | 18420 | 17262 | -0.583 | -0.4347 | Yes | ||
| 47 | SMAD6 | 19083 | 17307 | -0.603 | -0.3913 | Yes | ||
| 48 | SNRPD2 | 8412 | 17693 | -0.836 | -0.3487 | Yes | ||
| 49 | CBLB | 5531 22734 | 17786 | -0.905 | -0.2849 | Yes | ||
| 50 | PIP5K2B | 20269 1254 | 17898 | -0.968 | -0.2175 | Yes | ||
| 51 | ADSL | 4358 | 18020 | -1.099 | -0.1407 | Yes | ||
| 52 | EIF4A1 | 8889 23719 | 18492 | -2.278 | 0.0067 | Yes |