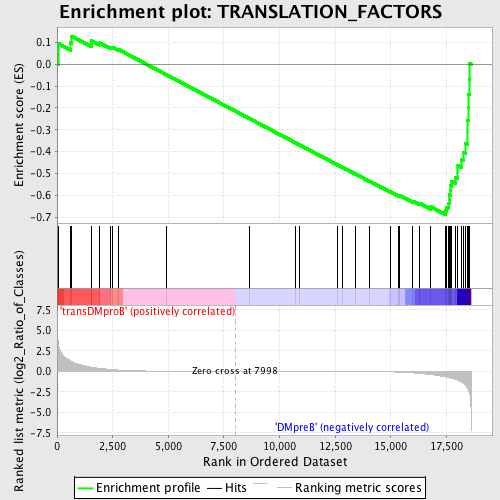
Profile of the Running ES Score & Positions of GeneSet Members on the Rank Ordered List
| Dataset | Set_04_transDMproB_versus_DMpreB.phenotype_transDMproB_versus_DMpreB.cls #transDMproB_versus_DMpreB.phenotype_transDMproB_versus_DMpreB.cls #transDMproB_versus_DMpreB_repos |
| Phenotype | phenotype_transDMproB_versus_DMpreB.cls#transDMproB_versus_DMpreB_repos |
| Upregulated in class | DMpreB |
| GeneSet | TRANSLATION_FACTORS |
| Enrichment Score (ES) | -0.68809426 |
| Normalized Enrichment Score (NES) | -1.4297496 |
| Nominal p-value | 0.039647575 |
| FDR q-value | 0.34438655 |
| FWER p-Value | 1.0 |

| PROBE | DESCRIPTION (from dataset) | GENE SYMBOL | GENE_TITLE | RANK IN GENE LIST | RANK METRIC SCORE | RUNNING ES | CORE ENRICHMENT | |
|---|---|---|---|---|---|---|---|---|
| 1 | EIF3S4 | 6588 11988 | 44 | 3.629 | 0.0956 | No | ||
| 2 | EIF2AK2 | 22892 | 614 | 1.246 | 0.0987 | No | ||
| 3 | EIF4G3 | 10517 | 646 | 1.196 | 0.1293 | No | ||
| 4 | EIF2AK3 | 17421 | 1545 | 0.505 | 0.0946 | No | ||
| 5 | EIF4EBP2 | 4662 | 1550 | 0.500 | 0.1079 | No | ||
| 6 | EEF2K | 18101 | 1910 | 0.353 | 0.0980 | No | ||
| 7 | EIF2S2 | 7406 14383 | 2390 | 0.224 | 0.0783 | No | ||
| 8 | EEF1D | 12393 2309 | 2488 | 0.202 | 0.0786 | No | ||
| 9 | GSPT2 | 4806 | 2745 | 0.146 | 0.0687 | No | ||
| 10 | EIF3S5 | 18131 | 4912 | 0.013 | -0.0476 | No | ||
| 11 | EIF4A2 | 4660 1679 1645 | 8669 | -0.002 | -0.2497 | No | ||
| 12 | EIF3S1 | 905 8114 | 10707 | -0.007 | -0.3592 | No | ||
| 13 | EIF5B | 10391 5963 | 10900 | -0.008 | -0.3693 | No | ||
| 14 | EIF4E | 15403 1827 8890 | 12612 | -0.017 | -0.4610 | No | ||
| 15 | EIF4EBP1 | 8891 4661 | 12825 | -0.019 | -0.4719 | No | ||
| 16 | EIF2S1 | 4658 | 13425 | -0.026 | -0.5034 | No | ||
| 17 | EEF1A2 | 8880 14309 | 14041 | -0.037 | -0.5355 | No | ||
| 18 | PAIP1 | 21556 | 14971 | -0.073 | -0.5836 | No | ||
| 19 | EEF2 | 8881 4654 8882 | 15348 | -0.103 | -0.6010 | No | ||
| 20 | EIF2B2 | 21204 | 15373 | -0.106 | -0.5995 | No | ||
| 21 | EEF1G | 12480 | 15985 | -0.196 | -0.6271 | No | ||
| 22 | SLC35A4 | 12588 | 16301 | -0.262 | -0.6370 | No | ||
| 23 | EIF3S7 | 22226 | 16793 | -0.395 | -0.6527 | No | ||
| 24 | EIF3S2 | 15744 2342 2478 | 17451 | -0.669 | -0.6700 | Yes | ||
| 25 | EIF4G1 | 22818 | 17505 | -0.698 | -0.6540 | Yes | ||
| 26 | EIF2B4 | 16574 | 17589 | -0.755 | -0.6381 | Yes | ||
| 27 | EIF3S3 | 12652 | 17622 | -0.775 | -0.6189 | Yes | ||
| 28 | EIF3S8 | 7099 12100 | 17632 | -0.781 | -0.5983 | Yes | ||
| 29 | ITGB4BP | 9191 | 17681 | -0.826 | -0.5786 | Yes | ||
| 30 | EIF2AK1 | 4869 | 17689 | -0.831 | -0.5565 | Yes | ||
| 31 | PABPC1 | 5219 9522 9523 23572 | 17726 | -0.854 | -0.5354 | Yes | ||
| 32 | EEF1B2 | 4131 12063 | 17920 | -0.988 | -0.5191 | Yes | ||
| 33 | ETF1 | 23467 | 18013 | -1.092 | -0.4946 | Yes | ||
| 34 | EIF3S6 | 4924 | 18014 | -1.092 | -0.4651 | Yes | ||
| 35 | EIF5A | 11345 20379 6590 | 18187 | -1.340 | -0.4382 | Yes | ||
| 36 | EIF2B1 | 16368 3458 | 18250 | -1.416 | -0.4033 | Yes | ||
| 37 | EIF5 | 5736 | 18356 | -1.677 | -0.3636 | Yes | ||
| 38 | EIF2B3 | 16118 | 18455 | -2.083 | -0.3127 | Yes | ||
| 39 | EIF1AY | 2643 24219 | 18456 | -2.086 | -0.2563 | Yes | ||
| 40 | EIF2B5 | 1719 22822 | 18488 | -2.245 | -0.1974 | Yes | ||
| 41 | EIF4A1 | 8889 23719 | 18492 | -2.278 | -0.1360 | Yes | ||
| 42 | EIF3S10 | 4659 8887 | 18529 | -2.519 | -0.0699 | Yes | ||
| 43 | EIF3S9 | 16643 3528 | 18551 | -2.761 | 0.0035 | Yes |

