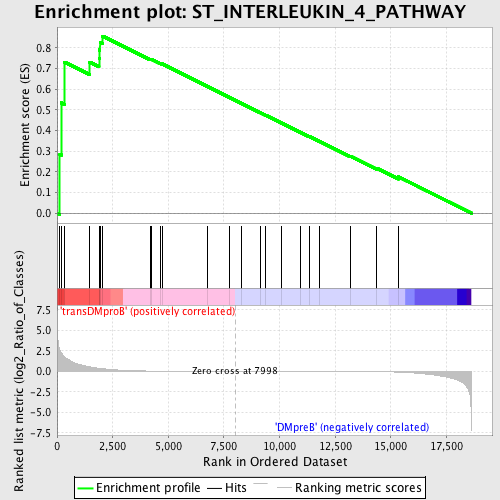
Profile of the Running ES Score & Positions of GeneSet Members on the Rank Ordered List
| Dataset | Set_04_transDMproB_versus_DMpreB.phenotype_transDMproB_versus_DMpreB.cls #transDMproB_versus_DMpreB.phenotype_transDMproB_versus_DMpreB.cls #transDMproB_versus_DMpreB_repos |
| Phenotype | phenotype_transDMproB_versus_DMpreB.cls#transDMproB_versus_DMpreB_repos |
| Upregulated in class | transDMproB |
| GeneSet | ST_INTERLEUKIN_4_PATHWAY |
| Enrichment Score (ES) | 0.8565854 |
| Normalized Enrichment Score (NES) | 1.566824 |
| Nominal p-value | 0.0057142857 |
| FDR q-value | 0.107713714 |
| FWER p-Value | 0.5 |
| PROBE | DESCRIPTION (from dataset) | GENE SYMBOL | GENE_TITLE | RANK IN GENE LIST | RANK METRIC SCORE | RUNNING ES | CORE ENRICHMENT | |
|---|---|---|---|---|---|---|---|---|
| 1 | CISH | 8743 | 122 | 2.563 | 0.2844 | Yes | ||
| 2 | INPP5D | 14198 | 188 | 2.231 | 0.5341 | Yes | ||
| 3 | JAK3 | 9198 4936 | 320 | 1.798 | 0.7312 | Yes | ||
| 4 | JAK1 | 15827 | 1468 | 0.543 | 0.7311 | Yes | ||
| 5 | SOS2 | 21049 | 1883 | 0.362 | 0.7500 | Yes | ||
| 6 | AKT3 | 13739 982 | 1896 | 0.357 | 0.7899 | Yes | ||
| 7 | GRB2 | 20149 | 1927 | 0.347 | 0.8277 | Yes | ||
| 8 | TYK2 | 12058 19215 | 2046 | 0.310 | 0.8566 | Yes | ||
| 9 | IL13RA1 | 24361 | 4183 | 0.027 | 0.7447 | No | ||
| 10 | RPS6KB1 | 7815 1207 13040 | 4229 | 0.026 | 0.7452 | No | ||
| 11 | IL4R | 18085 | 4646 | 0.016 | 0.7247 | No | ||
| 12 | SOS1 | 5476 | 4722 | 0.015 | 0.7224 | No | ||
| 13 | STAT6 | 19854 9909 | 6764 | 0.003 | 0.6129 | No | ||
| 14 | PIK3CA | 9562 | 7760 | 0.001 | 0.5595 | No | ||
| 15 | PPP1R13B | 10211 20980 | 8294 | -0.001 | 0.5309 | No | ||
| 16 | SHC1 | 9813 9812 5430 | 9137 | -0.003 | 0.4859 | No | ||
| 17 | IL4 | 9174 | 9384 | -0.003 | 0.4731 | No | ||
| 18 | AKT2 | 4365 4366 | 10087 | -0.005 | 0.4359 | No | ||
| 19 | NR0B2 | 16050 | 10936 | -0.008 | 0.3912 | No | ||
| 20 | SRC | 5507 | 11341 | -0.009 | 0.3705 | No | ||
| 21 | JAK2 | 23893 9197 3706 | 11807 | -0.012 | 0.3468 | No | ||
| 22 | AKT1 | 8568 | 13176 | -0.023 | 0.2759 | No | ||
| 23 | IARS | 4190 8361 8362 | 14346 | -0.045 | 0.2181 | No | ||
| 24 | IL2RG | 24096 | 15335 | -0.101 | 0.1765 | No |

