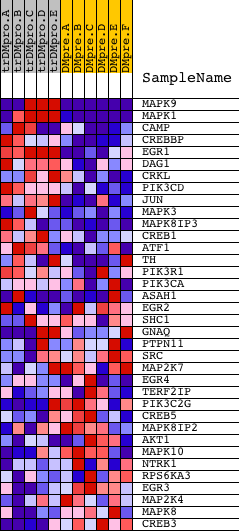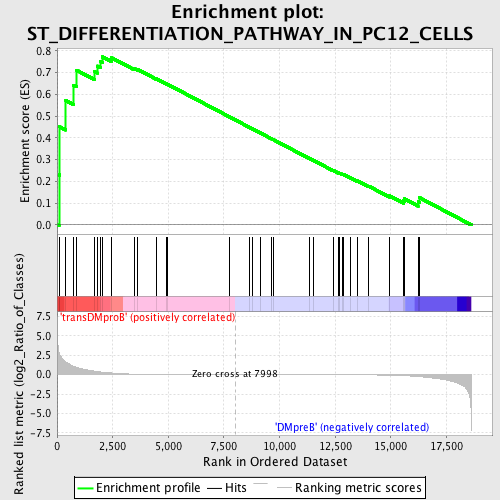
Profile of the Running ES Score & Positions of GeneSet Members on the Rank Ordered List
| Dataset | Set_04_transDMproB_versus_DMpreB.phenotype_transDMproB_versus_DMpreB.cls #transDMproB_versus_DMpreB.phenotype_transDMproB_versus_DMpreB.cls #transDMproB_versus_DMpreB_repos |
| Phenotype | phenotype_transDMproB_versus_DMpreB.cls#transDMproB_versus_DMpreB_repos |
| Upregulated in class | transDMproB |
| GeneSet | ST_DIFFERENTIATION_PATHWAY_IN_PC12_CELLS |
| Enrichment Score (ES) | 0.77243894 |
| Normalized Enrichment Score (NES) | 1.5070791 |
| Nominal p-value | 0.0055452865 |
| FDR q-value | 0.19895507 |
| FWER p-Value | 0.893 |
| PROBE | DESCRIPTION (from dataset) | GENE SYMBOL | GENE_TITLE | RANK IN GENE LIST | RANK METRIC SCORE | RUNNING ES | CORE ENRICHMENT | |
|---|---|---|---|---|---|---|---|---|
| 1 | MAPK9 | 1233 20903 1383 | 89 | 2.817 | 0.2300 | Yes | ||
| 2 | MAPK1 | 1642 11167 | 108 | 2.667 | 0.4512 | Yes | ||
| 3 | CAMP | 18990 | 389 | 1.624 | 0.5715 | Yes | ||
| 4 | CREBBP | 22682 8783 | 740 | 1.067 | 0.6416 | Yes | ||
| 5 | EGR1 | 23598 | 883 | 0.919 | 0.7105 | Yes | ||
| 6 | DAG1 | 18996 8837 | 1692 | 0.439 | 0.7036 | Yes | ||
| 7 | CRKL | 4560 | 1800 | 0.391 | 0.7305 | Yes | ||
| 8 | PIK3CD | 9563 | 1939 | 0.342 | 0.7515 | Yes | ||
| 9 | JUN | 15832 | 2037 | 0.313 | 0.7724 | Yes | ||
| 10 | MAPK3 | 6458 11170 | 2440 | 0.214 | 0.7686 | No | ||
| 11 | MAPK8IP3 | 11402 23080 | 3458 | 0.062 | 0.7191 | No | ||
| 12 | CREB1 | 3990 8782 4558 4093 | 3625 | 0.050 | 0.7144 | No | ||
| 13 | ATF1 | 8634 4417 | 4456 | 0.020 | 0.6714 | No | ||
| 14 | TH | 17548 | 4908 | 0.013 | 0.6482 | No | ||
| 15 | PIK3R1 | 3170 | 4940 | 0.013 | 0.6475 | No | ||
| 16 | PIK3CA | 9562 | 7760 | 0.001 | 0.4959 | No | ||
| 17 | ASAH1 | 3835 3853 8630 | 8643 | -0.002 | 0.4485 | No | ||
| 18 | EGR2 | 8886 | 8783 | -0.002 | 0.4412 | No | ||
| 19 | SHC1 | 9813 9812 5430 | 9137 | -0.003 | 0.4224 | No | ||
| 20 | GNAQ | 4786 23909 3685 | 9623 | -0.004 | 0.3967 | No | ||
| 21 | PTPN11 | 5326 16391 9660 | 9713 | -0.004 | 0.3922 | No | ||
| 22 | SRC | 5507 | 11341 | -0.009 | 0.3054 | No | ||
| 23 | MAP2K7 | 6453 | 11501 | -0.010 | 0.2977 | No | ||
| 24 | EGR4 | 24483 | 12416 | -0.016 | 0.2498 | No | ||
| 25 | TERF2IP | 12184 18463 7167 | 12629 | -0.017 | 0.2399 | No | ||
| 26 | PIK3C2G | 17253 | 12687 | -0.018 | 0.2383 | No | ||
| 27 | CREB5 | 10551 | 12839 | -0.019 | 0.2318 | No | ||
| 28 | MAPK8IP2 | 77 | 12876 | -0.020 | 0.2315 | No | ||
| 29 | AKT1 | 8568 | 13176 | -0.023 | 0.2173 | No | ||
| 30 | MAPK10 | 11169 | 13498 | -0.027 | 0.2023 | No | ||
| 31 | NTRK1 | 15299 | 14008 | -0.037 | 0.1779 | No | ||
| 32 | RPS6KA3 | 8490 | 14937 | -0.071 | 0.1339 | No | ||
| 33 | EGR3 | 4656 | 15573 | -0.129 | 0.1105 | No | ||
| 34 | MAP2K4 | 20405 | 15611 | -0.134 | 0.1197 | No | ||
| 35 | MAPK8 | 6459 | 16226 | -0.245 | 0.1071 | No | ||
| 36 | CREB3 | 16231 | 16284 | -0.258 | 0.1255 | No |