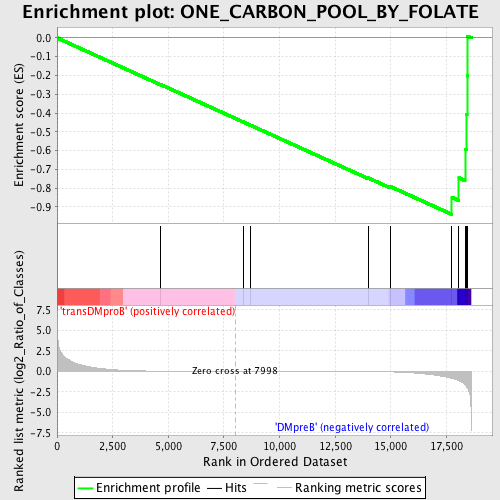
Profile of the Running ES Score & Positions of GeneSet Members on the Rank Ordered List
| Dataset | Set_04_transDMproB_versus_DMpreB.phenotype_transDMproB_versus_DMpreB.cls #transDMproB_versus_DMpreB.phenotype_transDMproB_versus_DMpreB.cls #transDMproB_versus_DMpreB_repos |
| Phenotype | phenotype_transDMproB_versus_DMpreB.cls#transDMproB_versus_DMpreB_repos |
| Upregulated in class | DMpreB |
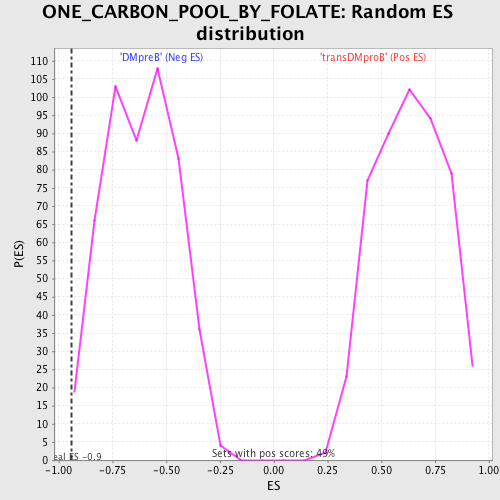
| GeneSet | ONE_CARBON_POOL_BY_FOLATE |
| Enrichment Score (ES) | -0.9403386 |
| Normalized Enrichment Score (NES) | -1.5313432 |
| Nominal p-value | 0.003944773 |
| FDR q-value | 0.17883857 |
| FWER p-Value | 0.77 |
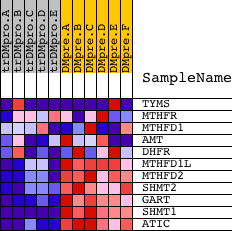
| PROBE | DESCRIPTION (from dataset) | GENE SYMBOL | GENE_TITLE | RANK IN GENE LIST | RANK METRIC SCORE | RUNNING ES | CORE ENRICHMENT | |
|---|---|---|---|---|---|---|---|---|
| 1 | TYMS | 5810 5809 3606 3598 | 4667 | 0.016 | -0.2492 | No | ||
| 2 | MTHFR | 5130 | 8356 | -0.001 | -0.4473 | No | ||
| 3 | MTHFD1 | 2132 21238 | 8706 | -0.002 | -0.4659 | No | ||
| 4 | AMT | 322 | 13979 | -0.036 | -0.7454 | No | ||
| 5 | DHFR | 21590 | 14962 | -0.072 | -0.7907 | No | ||
| 6 | MTHFD1L | 11300 | 17748 | -0.873 | -0.8489 | Yes | ||
| 7 | MTHFD2 | 17100 | 18063 | -1.152 | -0.7452 | Yes | ||
| 8 | SHMT2 | 3307 19601 | 18335 | -1.598 | -0.5925 | Yes | ||
| 9 | GART | 22543 1754 | 18397 | -1.806 | -0.4068 | Yes | ||
| 10 | SHMT1 | 5431 | 18427 | -1.966 | -0.2025 | Yes | ||
| 11 | ATIC | 14231 3968 | 18439 | -2.032 | 0.0095 | Yes |