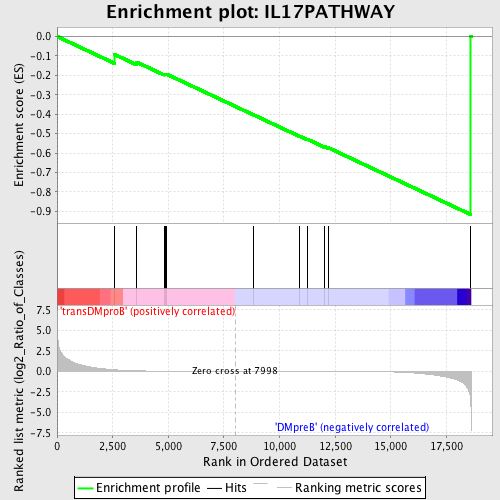
Profile of the Running ES Score & Positions of GeneSet Members on the Rank Ordered List
| Dataset | Set_04_transDMproB_versus_DMpreB.phenotype_transDMproB_versus_DMpreB.cls #transDMproB_versus_DMpreB.phenotype_transDMproB_versus_DMpreB.cls #transDMproB_versus_DMpreB_repos |
| Phenotype | phenotype_transDMproB_versus_DMpreB.cls#transDMproB_versus_DMpreB_repos |
| Upregulated in class | DMpreB |
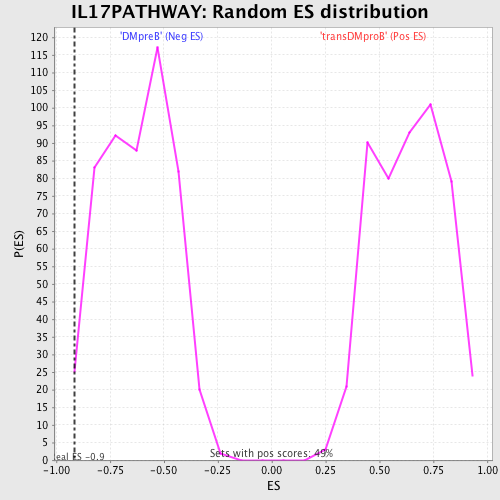
| GeneSet | IL17PATHWAY |
| Enrichment Score (ES) | -0.9164045 |
| Normalized Enrichment Score (NES) | -1.4712898 |
| Nominal p-value | 0.003929273 |
| FDR q-value | 0.26095316 |
| FWER p-Value | 0.979 |
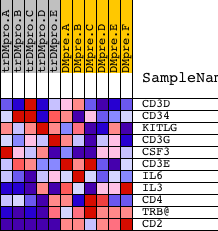
| PROBE | DESCRIPTION (from dataset) | GENE SYMBOL | GENE_TITLE | RANK IN GENE LIST | RANK METRIC SCORE | RUNNING ES | CORE ENRICHMENT | |
|---|---|---|---|---|---|---|---|---|
| 1 | CD3D | 19473 | 2592 | 0.180 | -0.0932 | No | ||
| 2 | CD34 | 14006 | 3573 | 0.054 | -0.1320 | No | ||
| 3 | KITLG | 19889 3342 | 4811 | 0.014 | -0.1949 | No | ||
| 4 | CD3G | 19139 | 4866 | 0.013 | -0.1944 | No | ||
| 5 | CSF3 | 1394 20671 | 4924 | 0.013 | -0.1942 | No | ||
| 6 | CD3E | 8714 | 8819 | -0.002 | -0.4030 | No | ||
| 7 | IL6 | 16895 | 10903 | -0.008 | -0.5129 | No | ||
| 8 | IL3 | 20453 | 11254 | -0.009 | -0.5294 | No | ||
| 9 | CD4 | 16999 | 12020 | -0.013 | -0.5673 | No | ||
| 10 | TRB@ | 1157 | 12176 | -0.014 | -0.5721 | Yes | ||
| 11 | CD2 | 15223 | 18584 | -3.577 | 0.0017 | Yes |