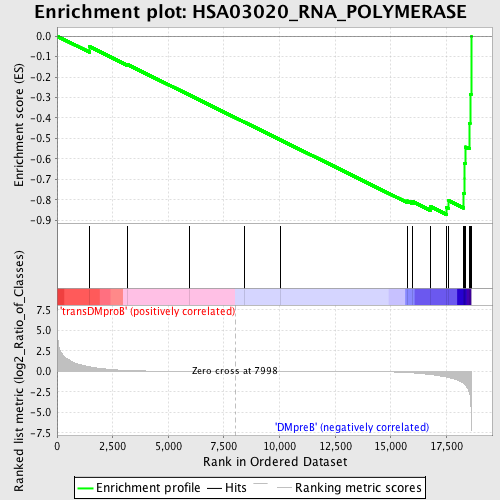
Profile of the Running ES Score & Positions of GeneSet Members on the Rank Ordered List
| Dataset | Set_04_transDMproB_versus_DMpreB.phenotype_transDMproB_versus_DMpreB.cls #transDMproB_versus_DMpreB.phenotype_transDMproB_versus_DMpreB.cls #transDMproB_versus_DMpreB_repos |
| Phenotype | phenotype_transDMproB_versus_DMpreB.cls#transDMproB_versus_DMpreB_repos |
| Upregulated in class | DMpreB |
| GeneSet | HSA03020_RNA_POLYMERASE |
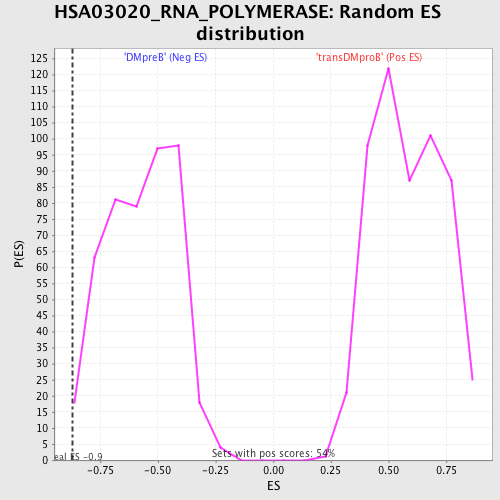
| Enrichment Score (ES) | -0.8721834 |
| Normalized Enrichment Score (NES) | -1.527476 |
| Nominal p-value | 0.008733625 |
| FDR q-value | 0.16272764 |
| FWER p-Value | 0.793 |
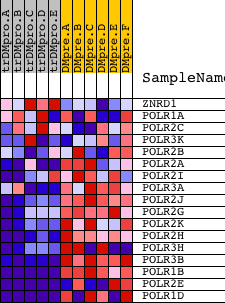
| PROBE | DESCRIPTION (from dataset) | GENE SYMBOL | GENE_TITLE | RANK IN GENE LIST | RANK METRIC SCORE | RUNNING ES | CORE ENRICHMENT | |
|---|---|---|---|---|---|---|---|---|
| 1 | ZNRD1 | 1491 22987 | 1460 | 0.545 | -0.0515 | No | ||
| 2 | POLR1A | 9749 5393 | 3151 | 0.090 | -0.1379 | No | ||
| 3 | POLR2C | 9750 | 5939 | 0.006 | -0.2875 | No | ||
| 4 | POLR3K | 12447 7372 | 8411 | -0.001 | -0.4203 | No | ||
| 5 | POLR2B | 16817 | 10051 | -0.005 | -0.5081 | No | ||
| 6 | POLR2A | 5394 | 15732 | -0.152 | -0.8060 | No | ||
| 7 | POLR2I | 12839 | 15977 | -0.195 | -0.8095 | No | ||
| 8 | POLR3A | 21900 | 16773 | -0.391 | -0.8329 | No | ||
| 9 | POLR2J | 16672 | 17504 | -0.698 | -0.8377 | Yes | ||
| 10 | POLR2G | 23753 | 17605 | -0.763 | -0.8053 | Yes | ||
| 11 | POLR2K | 9413 | 18265 | -1.440 | -0.7695 | Yes | ||
| 12 | POLR2H | 10888 | 18300 | -1.513 | -0.6965 | Yes | ||
| 13 | POLR3H | 13460 8135 | 18301 | -1.515 | -0.6216 | Yes | ||
| 14 | POLR3B | 12875 | 18347 | -1.658 | -0.5420 | Yes | ||
| 15 | POLR1B | 14857 | 18527 | -2.516 | -0.4272 | Yes | ||
| 16 | POLR2E | 3325 19699 | 18562 | -2.914 | -0.2849 | Yes | ||
| 17 | POLR1D | 3593 3658 16623 | 18611 | -5.818 | 0.0003 | Yes |