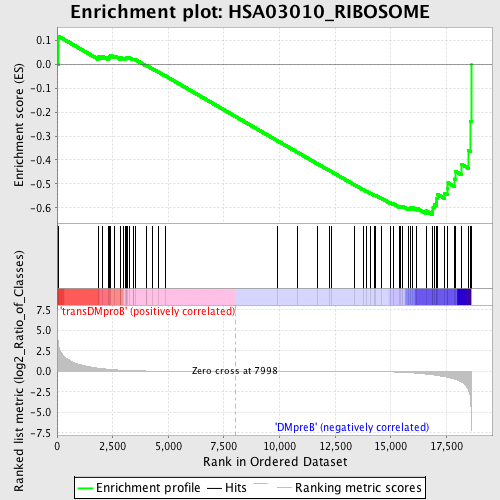
Profile of the Running ES Score & Positions of GeneSet Members on the Rank Ordered List
| Dataset | Set_04_transDMproB_versus_DMpreB.phenotype_transDMproB_versus_DMpreB.cls #transDMproB_versus_DMpreB.phenotype_transDMproB_versus_DMpreB.cls #transDMproB_versus_DMpreB_repos |
| Phenotype | phenotype_transDMproB_versus_DMpreB.cls#transDMproB_versus_DMpreB_repos |
| Upregulated in class | DMpreB |
| GeneSet | HSA03010_RIBOSOME |
| Enrichment Score (ES) | -0.6279536 |
| Normalized Enrichment Score (NES) | -1.3730931 |
| Nominal p-value | 0.043778803 |
| FDR q-value | 0.511118 |
| FWER p-Value | 1.0 |
| PROBE | DESCRIPTION (from dataset) | GENE SYMBOL | GENE_TITLE | RANK IN GENE LIST | RANK METRIC SCORE | RUNNING ES | CORE ENRICHMENT | |
|---|---|---|---|---|---|---|---|---|
| 1 | RPL3L | 23354 | 51 | 3.504 | 0.1178 | No | ||
| 2 | RPS25 | 13270 | 1877 | 0.364 | 0.0320 | No | ||
| 3 | RPL28 | 5392 | 2053 | 0.309 | 0.0332 | No | ||
| 4 | RPL11 | 12450 | 2322 | 0.239 | 0.0270 | No | ||
| 5 | RPL39 | 12496 | 2355 | 0.232 | 0.0332 | No | ||
| 6 | RPS27 | 12183 | 2407 | 0.220 | 0.0380 | No | ||
| 7 | RPS28 | 12009 | 2588 | 0.181 | 0.0346 | No | ||
| 8 | RPS7 | 9760 | 2839 | 0.131 | 0.0256 | No | ||
| 9 | RPS15A | 6476 | 2869 | 0.125 | 0.0283 | No | ||
| 10 | RPS11 | 11317 | 2987 | 0.107 | 0.0257 | No | ||
| 11 | RPS26 | 11331 | 3060 | 0.098 | 0.0252 | No | ||
| 12 | RPL35 | 12360 | 3096 | 0.096 | 0.0266 | No | ||
| 13 | RPS20 | 7438 | 3110 | 0.094 | 0.0292 | No | ||
| 14 | RPS18 | 1529 5397 1603 | 3165 | 0.088 | 0.0293 | No | ||
| 15 | RPL37A | 9744 | 3259 | 0.079 | 0.0270 | No | ||
| 16 | RPL13 | 11284 | 3417 | 0.065 | 0.0208 | No | ||
| 17 | RPL7 | 9748 | 3454 | 0.062 | 0.0210 | No | ||
| 18 | RPS21 | 12356 | 3518 | 0.058 | 0.0196 | No | ||
| 19 | RPS5 | 18391 | 4016 | 0.032 | -0.0061 | No | ||
| 20 | RPL18A | 13358 | 4031 | 0.032 | -0.0057 | No | ||
| 21 | RPL27 | 9740 | 4294 | 0.024 | -0.0190 | No | ||
| 22 | RPS13 | 12633 | 4564 | 0.018 | -0.0329 | No | ||
| 23 | RPS29 | 9754 | 4881 | 0.013 | -0.0495 | No | ||
| 24 | RPS8 | 9761 | 9921 | -0.005 | -0.3209 | No | ||
| 25 | RPS3 | 6549 11295 | 10822 | -0.007 | -0.3691 | No | ||
| 26 | RPL18 | 450 5390 | 11686 | -0.011 | -0.4152 | No | ||
| 27 | RPSA | 19270 4984 | 12226 | -0.014 | -0.4438 | No | ||
| 28 | RPS16 | 9752 | 12339 | -0.015 | -0.4493 | No | ||
| 29 | RPL19 | 9736 | 13379 | -0.026 | -0.5044 | No | ||
| 30 | RPL26 | 9739 | 13758 | -0.032 | -0.5237 | No | ||
| 31 | RPL41 | 12611 | 13922 | -0.035 | -0.5313 | No | ||
| 32 | RPS10 | 12464 | 14107 | -0.039 | -0.5398 | No | ||
| 33 | RPL24 | 12664 | 14271 | -0.043 | -0.5471 | No | ||
| 34 | RPL35A | 12194 | 14320 | -0.044 | -0.5482 | No | ||
| 35 | RPL37 | 12502 7421 22521 | 14583 | -0.054 | -0.5605 | No | ||
| 36 | RPL8 | 22437 | 14981 | -0.074 | -0.5793 | No | ||
| 37 | RPL32 | 9743 | 15103 | -0.082 | -0.5830 | No | ||
| 38 | RPL36A | 9745 | 15403 | -0.110 | -0.5953 | No | ||
| 39 | RPL23A | 11193 | 15456 | -0.115 | -0.5942 | No | ||
| 40 | RPS23 | 12352 | 15534 | -0.125 | -0.5940 | No | ||
| 41 | FAU | 8954 | 15812 | -0.164 | -0.6033 | No | ||
| 42 | RPL3 | 11330 | 15875 | -0.177 | -0.6006 | No | ||
| 43 | RPL13A | 10226 79 | 15964 | -0.192 | -0.5987 | No | ||
| 44 | RPS3A | 9755 | 16163 | -0.228 | -0.6016 | No | ||
| 45 | RPL10A | 9735 | 16594 | -0.337 | -0.6131 | No | ||
| 46 | RPS6 | 9757 | 16870 | -0.420 | -0.6135 | Yes | ||
| 47 | RPL29 | 9741 | 16894 | -0.433 | -0.5998 | Yes | ||
| 48 | RPS2 | 9279 | 16943 | -0.452 | -0.5868 | Yes | ||
| 49 | RPL36AL | 12357 | 17049 | -0.488 | -0.5757 | Yes | ||
| 50 | RPL31 | 14267 | 17067 | -0.496 | -0.5596 | Yes | ||
| 51 | RPL6 | 9747 | 17100 | -0.508 | -0.5438 | Yes | ||
| 52 | RPL12 | 11243 | 17410 | -0.649 | -0.5382 | Yes | ||
| 53 | RPL14 | 19267 | 17549 | -0.733 | -0.5204 | Yes | ||
| 54 | RPL21 | 9737 16624 5391 | 17569 | -0.745 | -0.4958 | Yes | ||
| 55 | MRPS7 | 20595 | 17878 | -0.953 | -0.4796 | Yes | ||
| 56 | RPS24 | 5399 | 17893 | -0.962 | -0.4472 | Yes | ||
| 57 | RPL30 | 9742 | 18161 | -1.285 | -0.4174 | Yes | ||
| 58 | RPL27A | 11181 6467 18130 | 18477 | -2.186 | -0.3592 | Yes | ||
| 59 | MRPL13 | 2249 22294 | 18588 | -3.654 | -0.2394 | Yes | ||
| 60 | RPL38 | 12562 20606 7475 | 18614 | -7.000 | 0.0001 | Yes |

