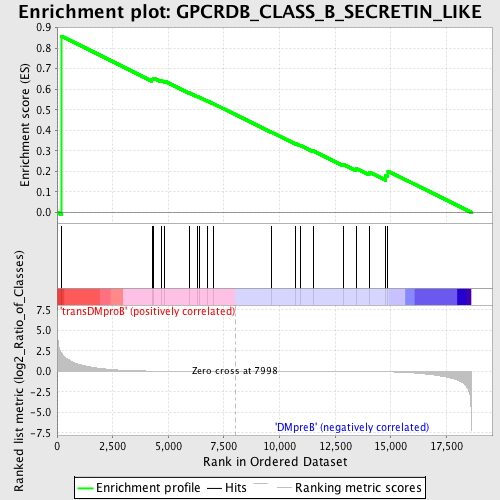
Profile of the Running ES Score & Positions of GeneSet Members on the Rank Ordered List
| Dataset | Set_04_transDMproB_versus_DMpreB.phenotype_transDMproB_versus_DMpreB.cls #transDMproB_versus_DMpreB.phenotype_transDMproB_versus_DMpreB.cls #transDMproB_versus_DMpreB_repos |
| Phenotype | phenotype_transDMproB_versus_DMpreB.cls#transDMproB_versus_DMpreB_repos |
| Upregulated in class | transDMproB |
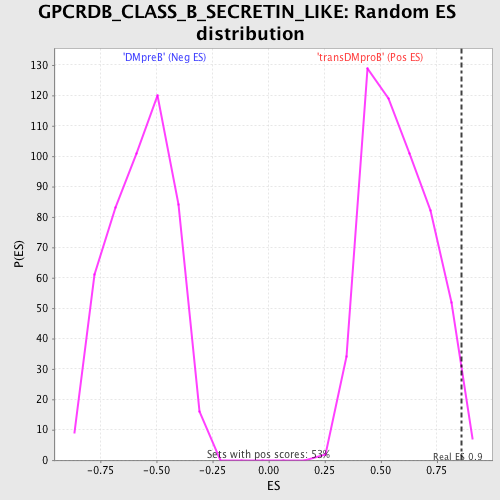
| GeneSet | GPCRDB_CLASS_B_SECRETIN_LIKE |
| Enrichment Score (ES) | 0.8584301 |
| Normalized Enrichment Score (NES) | 1.4918247 |
| Nominal p-value | 0.013307985 |
| FDR q-value | 0.19538997 |
| FWER p-Value | 0.956 |
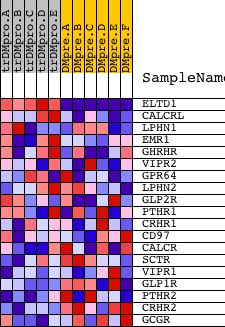
| PROBE | DESCRIPTION (from dataset) | GENE SYMBOL | GENE_TITLE | RANK IN GENE LIST | RANK METRIC SCORE | RUNNING ES | CORE ENRICHMENT | |
|---|---|---|---|---|---|---|---|---|
| 1 | ELTD1 | 15391 | 186 | 2.234 | 0.8584 | Yes | ||
| 2 | CALCRL | 12041 | 4265 | 0.025 | 0.6488 | No | ||
| 3 | LPHN1 | 6850 174 | 4337 | 0.023 | 0.6540 | No | ||
| 4 | EMR1 | 1506 23172 | 4673 | 0.016 | 0.6422 | No | ||
| 5 | GHRHR | 1007 17436 | 4848 | 0.013 | 0.6380 | No | ||
| 6 | VIPR2 | 21125 | 5934 | 0.006 | 0.5820 | No | ||
| 7 | GPR64 | 24217 2644 | 6287 | 0.005 | 0.5649 | No | ||
| 8 | LPHN2 | 13619 | 6399 | 0.004 | 0.5606 | No | ||
| 9 | GLP2R | 8227 13563 13564 | 6757 | 0.003 | 0.5426 | No | ||
| 10 | PTHR1 | 5318 18985 | 7021 | 0.002 | 0.5294 | No | ||
| 11 | CRHR1 | 1464 1468 20633 | 9624 | -0.004 | 0.3911 | No | ||
| 12 | CD97 | 18822 3874 | 10732 | -0.007 | 0.3343 | No | ||
| 13 | CALCR | 17229 | 10932 | -0.008 | 0.3267 | No | ||
| 14 | SCTR | 14157 | 11508 | -0.010 | 0.2997 | No | ||
| 15 | VIPR1 | 3048 19264 3012 | 12856 | -0.019 | 0.2347 | No | ||
| 16 | GLP1R | 23304 | 13435 | -0.026 | 0.2139 | No | ||
| 17 | PTHR2 | 10032 | 14024 | -0.037 | 0.1967 | No | ||
| 18 | CRHR2 | 17140 | 14758 | -0.062 | 0.1812 | No | ||
| 19 | GCGR | 20566 | 14870 | -0.067 | 0.2014 | No |