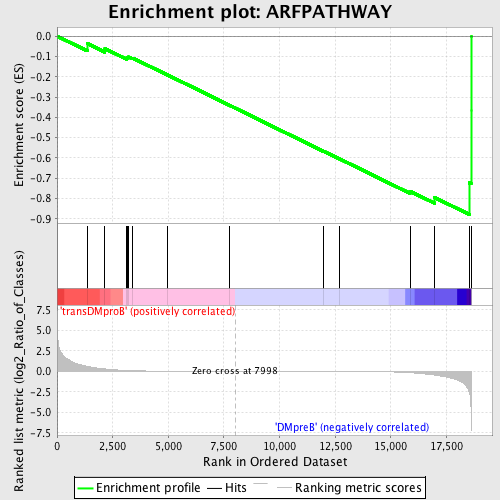
Profile of the Running ES Score & Positions of GeneSet Members on the Rank Ordered List
| Dataset | Set_04_transDMproB_versus_DMpreB.phenotype_transDMproB_versus_DMpreB.cls #transDMproB_versus_DMpreB.phenotype_transDMproB_versus_DMpreB.cls #transDMproB_versus_DMpreB_repos |
| Phenotype | phenotype_transDMproB_versus_DMpreB.cls#transDMproB_versus_DMpreB_repos |
| Upregulated in class | DMpreB |
| GeneSet | ARFPATHWAY |
| Enrichment Score (ES) | -0.8787841 |
| Normalized Enrichment Score (NES) | -1.4984887 |
| Nominal p-value | 0.007968128 |
| FDR q-value | 0.23682718 |
| FWER p-Value | 0.919 |
| PROBE | DESCRIPTION (from dataset) | GENE SYMBOL | GENE_TITLE | RANK IN GENE LIST | RANK METRIC SCORE | RUNNING ES | CORE ENRICHMENT | |
|---|---|---|---|---|---|---|---|---|
| 1 | TP53 | 20822 | 1359 | 0.593 | -0.0364 | No | ||
| 2 | RAC1 | 16302 | 2149 | 0.281 | -0.0614 | No | ||
| 3 | MYC | 22465 9435 | 3120 | 0.093 | -0.1078 | No | ||
| 4 | POLR1A | 9749 5393 | 3151 | 0.090 | -0.1038 | No | ||
| 5 | ABL1 | 2693 4301 2794 | 3222 | 0.082 | -0.1025 | No | ||
| 6 | RB1 | 21754 | 3396 | 0.067 | -0.1077 | No | ||
| 7 | PIK3R1 | 3170 | 4940 | 0.013 | -0.1898 | No | ||
| 8 | PIK3CA | 9562 | 7760 | 0.001 | -0.3413 | No | ||
| 9 | TBX2 | 20720 | 11979 | -0.013 | -0.5673 | No | ||
| 10 | MDM2 | 19620 3327 | 12679 | -0.018 | -0.6038 | No | ||
| 11 | TWIST1 | 21291 | 15865 | -0.174 | -0.7642 | No | ||
| 12 | E2F1 | 14384 | 16964 | -0.459 | -0.7948 | Yes | ||
| 13 | POLR1B | 14857 | 18527 | -2.516 | -0.7230 | Yes | ||
| 14 | POLR1D | 3593 3658 16623 | 18611 | -5.818 | -0.3672 | Yes | ||
| 15 | CDKN2A | 2491 15841 | 18612 | -5.935 | 0.0002 | Yes |

