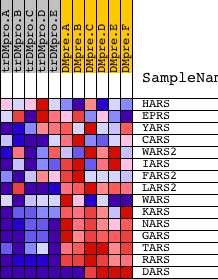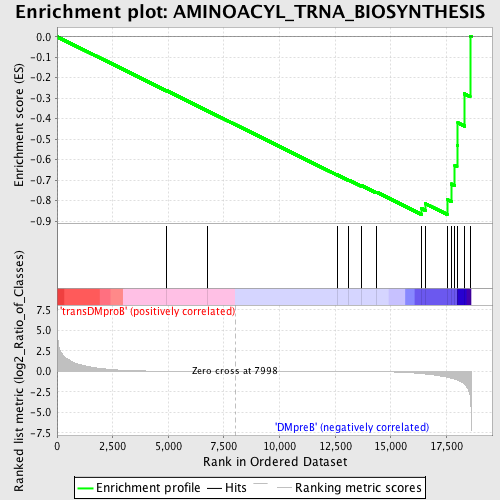
Profile of the Running ES Score & Positions of GeneSet Members on the Rank Ordered List
| Dataset | Set_04_transDMproB_versus_DMpreB.phenotype_transDMproB_versus_DMpreB.cls #transDMproB_versus_DMpreB.phenotype_transDMproB_versus_DMpreB.cls #transDMproB_versus_DMpreB_repos |
| Phenotype | phenotype_transDMproB_versus_DMpreB.cls#transDMproB_versus_DMpreB_repos |
| Upregulated in class | DMpreB |
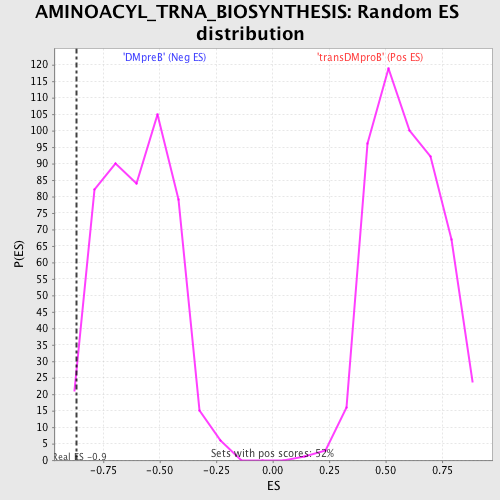
| GeneSet | AMINOACYL_TRNA_BIOSYNTHESIS |
| Enrichment Score (ES) | -0.86731285 |
| Normalized Enrichment Score (NES) | -1.4482667 |
| Nominal p-value | 0.020746889 |
| FDR q-value | 0.31149602 |
| FWER p-Value | 0.998 |
| PROBE | DESCRIPTION (from dataset) | GENE SYMBOL | GENE_TITLE | RANK IN GENE LIST | RANK METRIC SCORE | RUNNING ES | CORE ENRICHMENT | |
|---|---|---|---|---|---|---|---|---|
| 1 | HARS | 23451 | 4930 | 0.013 | -0.2637 | No | ||
| 2 | EPRS | 14014 | 6779 | 0.003 | -0.3628 | No | ||
| 3 | YARS | 16071 | 12601 | -0.017 | -0.6740 | No | ||
| 4 | CARS | 1683 17544 | 13119 | -0.022 | -0.6995 | No | ||
| 5 | WARS2 | 12884 7688 | 13699 | -0.031 | -0.7275 | No | ||
| 6 | IARS | 4190 8361 8362 | 14346 | -0.045 | -0.7577 | No | ||
| 7 | FARS2 | 21666 | 16379 | -0.279 | -0.8386 | Yes | ||
| 8 | LARS2 | 19255 | 16561 | -0.327 | -0.8152 | Yes | ||
| 9 | WARS | 2085 20984 | 17532 | -0.718 | -0.7945 | Yes | ||
| 10 | KARS | 18738 | 17727 | -0.854 | -0.7184 | Yes | ||
| 11 | NARS | 23418 | 17879 | -0.953 | -0.6298 | Yes | ||
| 12 | GARS | 17438 | 17975 | -1.042 | -0.5292 | Yes | ||
| 13 | TARS | 22325 8502 | 18015 | -1.093 | -0.4205 | Yes | ||
| 14 | RARS | 20496 | 18316 | -1.556 | -0.2788 | Yes | ||
| 15 | DARS | 10375 13846 | 18561 | -2.907 | 0.0030 | Yes |