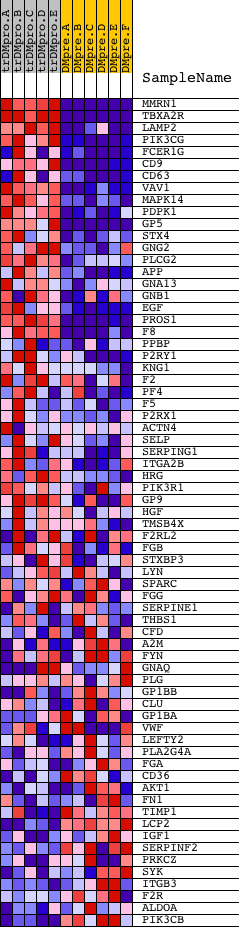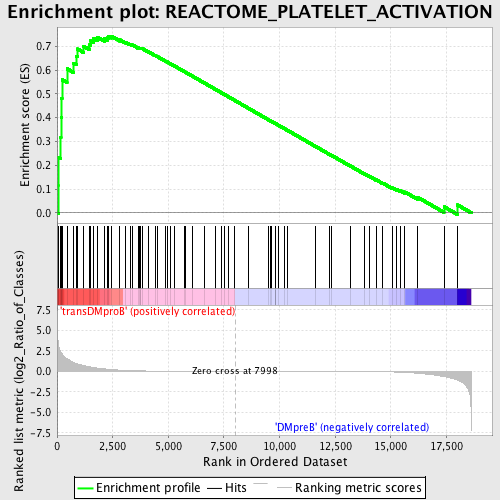
Profile of the Running ES Score & Positions of GeneSet Members on the Rank Ordered List
| Dataset | Set_04_transDMproB_versus_DMpreB.phenotype_transDMproB_versus_DMpreB.cls #transDMproB_versus_DMpreB.phenotype_transDMproB_versus_DMpreB.cls #transDMproB_versus_DMpreB_repos |
| Phenotype | phenotype_transDMproB_versus_DMpreB.cls#transDMproB_versus_DMpreB_repos |
| Upregulated in class | transDMproB |
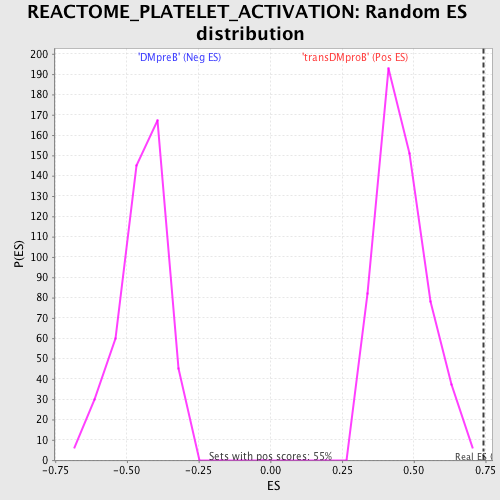
| GeneSet | REACTOME_PLATELET_ACTIVATION |
| Enrichment Score (ES) | 0.74240667 |
| Normalized Enrichment Score (NES) | 1.6175275 |
| Nominal p-value | 0.0 |
| FDR q-value | 0.10498774 |
| FWER p-Value | 0.253 |
| PROBE | DESCRIPTION (from dataset) | GENE SYMBOL | GENE_TITLE | RANK IN GENE LIST | RANK METRIC SCORE | RUNNING ES | CORE ENRICHMENT | |
|---|---|---|---|---|---|---|---|---|
| 1 | MMRN1 | 17428 | 63 | 3.188 | 0.1164 | Yes | ||
| 2 | TBXA2R | 3392 19928 | 67 | 3.121 | 0.2336 | Yes | ||
| 3 | LAMP2 | 9267 2653 | 166 | 2.313 | 0.3152 | Yes | ||
| 4 | PIK3CG | 6635 | 176 | 2.268 | 0.3999 | Yes | ||
| 5 | FCER1G | 13759 | 194 | 2.206 | 0.4819 | Yes | ||
| 6 | CD9 | 16992 | 223 | 2.106 | 0.5595 | Yes | ||
| 7 | CD63 | 8716 | 447 | 1.537 | 0.6053 | Yes | ||
| 8 | VAV1 | 23173 | 746 | 1.053 | 0.6288 | Yes | ||
| 9 | MAPK14 | 23313 | 872 | 0.931 | 0.6570 | Yes | ||
| 10 | PDPK1 | 23097 | 914 | 0.896 | 0.6885 | Yes | ||
| 11 | GP5 | 22616 | 1186 | 0.691 | 0.6999 | Yes | ||
| 12 | STX4 | 18062 | 1462 | 0.544 | 0.7055 | Yes | ||
| 13 | GNG2 | 4790 | 1512 | 0.521 | 0.7224 | Yes | ||
| 14 | PLCG2 | 18453 | 1636 | 0.463 | 0.7332 | Yes | ||
| 15 | APP | 4402 | 1813 | 0.385 | 0.7382 | Yes | ||
| 16 | GNA13 | 20617 | 2135 | 0.285 | 0.7316 | Yes | ||
| 17 | GNB1 | 15967 | 2253 | 0.254 | 0.7348 | Yes | ||
| 18 | EGF | 15169 | 2310 | 0.241 | 0.7408 | Yes | ||
| 19 | PROS1 | 22725 | 2432 | 0.215 | 0.7424 | Yes | ||
| 20 | F8 | 2584 24123 | 2818 | 0.134 | 0.7267 | No | ||
| 21 | PPBP | 16801 | 3068 | 0.098 | 0.7170 | No | ||
| 22 | P2RY1 | 15581 | 3288 | 0.077 | 0.7080 | No | ||
| 23 | KNG1 | 9244 22809 | 3386 | 0.068 | 0.7053 | No | ||
| 24 | F2 | 14524 | 3648 | 0.049 | 0.6931 | No | ||
| 25 | PF4 | 16800 | 3714 | 0.046 | 0.6913 | No | ||
| 26 | F5 | 8941 | 3755 | 0.044 | 0.6908 | No | ||
| 27 | P2RX1 | 20794 1294 | 3756 | 0.044 | 0.6925 | No | ||
| 28 | ACTN4 | 17905 1798 1983 | 3815 | 0.041 | 0.6909 | No | ||
| 29 | SELP | 14073 | 4112 | 0.029 | 0.6760 | No | ||
| 30 | SERPING1 | 14546 | 4405 | 0.021 | 0.6611 | No | ||
| 31 | ITGA2B | 9186 | 4503 | 0.019 | 0.6566 | No | ||
| 32 | HRG | 22810 | 4878 | 0.013 | 0.6369 | No | ||
| 33 | PIK3R1 | 3170 | 4940 | 0.013 | 0.6341 | No | ||
| 34 | GP9 | 17374 | 5090 | 0.011 | 0.6265 | No | ||
| 35 | HGF | 16916 | 5279 | 0.010 | 0.6167 | No | ||
| 36 | TMSB4X | 24005 | 5732 | 0.007 | 0.5926 | No | ||
| 37 | F2RL2 | 21580 | 5764 | 0.007 | 0.5912 | No | ||
| 38 | FGB | 15309 | 6089 | 0.005 | 0.5739 | No | ||
| 39 | STXBP3 | 9931 | 6602 | 0.004 | 0.5464 | No | ||
| 40 | LYN | 16281 | 7120 | 0.002 | 0.5186 | No | ||
| 41 | SPARC | 20444 | 7403 | 0.001 | 0.5035 | No | ||
| 42 | FGG | 1891 | 7531 | 0.001 | 0.4967 | No | ||
| 43 | SERPINE1 | 16333 | 7699 | 0.001 | 0.4877 | No | ||
| 44 | THBS1 | 5748 14910 | 7978 | 0.000 | 0.4727 | No | ||
| 45 | CFD | 19957 | 8585 | -0.001 | 0.4401 | No | ||
| 46 | A2M | 17298 | 9499 | -0.004 | 0.3910 | No | ||
| 47 | FYN | 3375 3395 20052 | 9586 | -0.004 | 0.3865 | No | ||
| 48 | GNAQ | 4786 23909 3685 | 9623 | -0.004 | 0.3847 | No | ||
| 49 | PLG | 1593 23383 | 9797 | -0.004 | 0.3756 | No | ||
| 50 | GP1BB | 9031 | 9809 | -0.004 | 0.3751 | No | ||
| 51 | CLU | 21979 | 9822 | -0.004 | 0.3747 | No | ||
| 52 | GP1BA | 13683 | 9951 | -0.005 | 0.3679 | No | ||
| 53 | VWF | 17277 | 10215 | -0.006 | 0.3540 | No | ||
| 54 | LEFTY2 | 6735 | 10355 | -0.006 | 0.3467 | No | ||
| 55 | PLA2G4A | 13809 | 11620 | -0.011 | 0.2790 | No | ||
| 56 | FGA | 1780 15566 | 12241 | -0.014 | 0.2461 | No | ||
| 57 | CD36 | 8712 | 12331 | -0.015 | 0.2418 | No | ||
| 58 | AKT1 | 8568 | 13176 | -0.023 | 0.1972 | No | ||
| 59 | FN1 | 4091 4094 971 13929 | 13809 | -0.033 | 0.1643 | No | ||
| 60 | TIMP1 | 24366 | 14040 | -0.037 | 0.1534 | No | ||
| 61 | LCP2 | 4988 9268 | 14343 | -0.045 | 0.1388 | No | ||
| 62 | IGF1 | 3352 9156 3409 | 14645 | -0.057 | 0.1247 | No | ||
| 63 | SERPINF2 | 9589 20348 | 15071 | -0.080 | 0.1048 | No | ||
| 64 | PRKCZ | 5260 | 15276 | -0.095 | 0.0973 | No | ||
| 65 | SYK | 21636 | 15422 | -0.112 | 0.0937 | No | ||
| 66 | ITGB3 | 20631 | 15630 | -0.137 | 0.0877 | No | ||
| 67 | F2R | 21386 | 16204 | -0.237 | 0.0657 | No | ||
| 68 | ALDOA | 8572 | 17392 | -0.638 | 0.0257 | No | ||
| 69 | PIK3CB | 19030 | 17997 | -1.070 | 0.0334 | No |