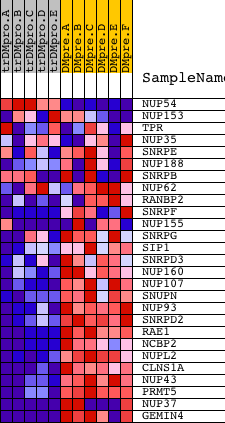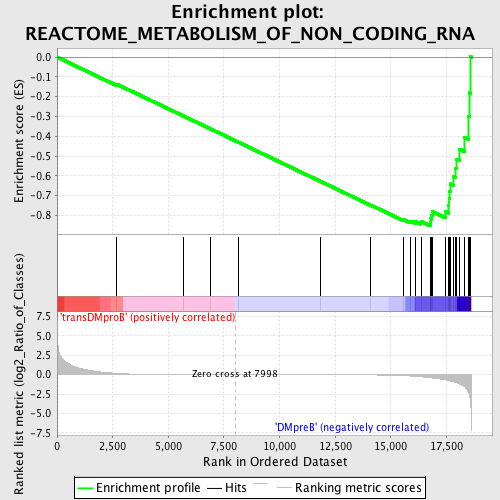
Profile of the Running ES Score & Positions of GeneSet Members on the Rank Ordered List
| Dataset | Set_04_transDMproB_versus_DMpreB.phenotype_transDMproB_versus_DMpreB.cls #transDMproB_versus_DMpreB.phenotype_transDMproB_versus_DMpreB.cls #transDMproB_versus_DMpreB_repos |
| Phenotype | phenotype_transDMproB_versus_DMpreB.cls#transDMproB_versus_DMpreB_repos |
| Upregulated in class | DMpreB |
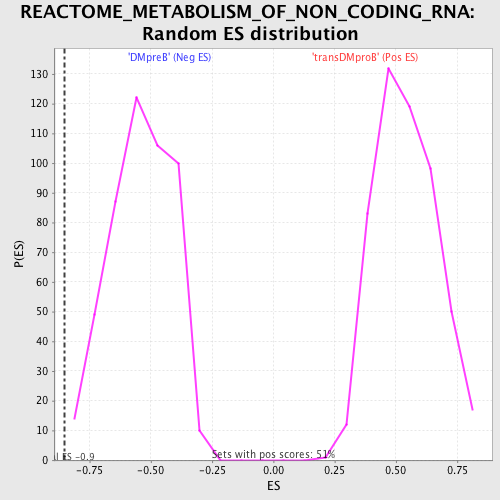
| GeneSet | REACTOME_METABOLISM_OF_NON_CODING_RNA |
| Enrichment Score (ES) | -0.8533932 |
| Normalized Enrichment Score (NES) | -1.5863404 |
| Nominal p-value | 0.0020491802 |
| FDR q-value | 0.06590622 |
| FWER p-Value | 0.555 |
| PROBE | DESCRIPTION (from dataset) | GENE SYMBOL | GENE_TITLE | RANK IN GENE LIST | RANK METRIC SCORE | RUNNING ES | CORE ENRICHMENT | |
|---|---|---|---|---|---|---|---|---|
| 1 | NUP54 | 11231 11232 6516 | 2686 | 0.159 | -0.1369 | No | ||
| 2 | NUP153 | 21474 | 5687 | 0.007 | -0.2980 | No | ||
| 3 | TPR | 927 4255 | 6880 | 0.003 | -0.3619 | No | ||
| 4 | NUP35 | 12803 | 8155 | -0.000 | -0.4305 | No | ||
| 5 | SNRPE | 9843 | 11840 | -0.012 | -0.6281 | No | ||
| 6 | NUP188 | 15053 | 14106 | -0.039 | -0.7480 | No | ||
| 7 | SNRPB | 9842 5469 2736 | 15574 | -0.129 | -0.8208 | No | ||
| 8 | NUP62 | 9497 | 15877 | -0.178 | -0.8285 | No | ||
| 9 | RANBP2 | 20019 | 16117 | -0.220 | -0.8309 | No | ||
| 10 | SNRPF | 7645 | 16356 | -0.273 | -0.8307 | No | ||
| 11 | NUP155 | 2298 5027 | 16779 | -0.392 | -0.8347 | Yes | ||
| 12 | SNRPG | 12622 | 16801 | -0.397 | -0.8168 | Yes | ||
| 13 | SIP1 | 21263 | 16833 | -0.408 | -0.7990 | Yes | ||
| 14 | SNRPD3 | 12514 | 16876 | -0.426 | -0.7809 | Yes | ||
| 15 | NUP160 | 14957 | 17457 | -0.672 | -0.7801 | Yes | ||
| 16 | NUP107 | 8337 | 17608 | -0.765 | -0.7516 | Yes | ||
| 17 | SNUPN | 12282 | 17614 | -0.769 | -0.7152 | Yes | ||
| 18 | NUP93 | 7762 | 17648 | -0.802 | -0.6787 | Yes | ||
| 19 | SNRPD2 | 8412 | 17693 | -0.836 | -0.6411 | Yes | ||
| 20 | RAE1 | 12395 | 17803 | -0.914 | -0.6034 | Yes | ||
| 21 | NCBP2 | 12643 | 17923 | -0.989 | -0.5625 | Yes | ||
| 22 | NUPL2 | 6072 | 17965 | -1.029 | -0.5156 | Yes | ||
| 23 | CLNS1A | 4526 4525 | 18095 | -1.188 | -0.4658 | Yes | ||
| 24 | NUP43 | 20094 | 18304 | -1.526 | -0.4041 | Yes | ||
| 25 | PRMT5 | 6571 2817 | 18507 | -2.388 | -0.3010 | Yes | ||
| 26 | NUP37 | 3294 3326 19909 | 18533 | -2.548 | -0.1807 | Yes | ||
| 27 | GEMIN4 | 6592 6591 | 18592 | -3.878 | 0.0013 | Yes |