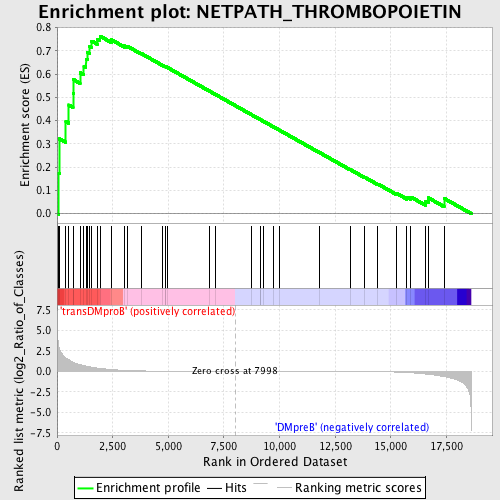
Profile of the Running ES Score & Positions of GeneSet Members on the Rank Ordered List
| Dataset | Set_04_transDMproB_versus_DMpreB.phenotype_transDMproB_versus_DMpreB.cls #transDMproB_versus_DMpreB.phenotype_transDMproB_versus_DMpreB.cls #transDMproB_versus_DMpreB_repos |
| Phenotype | phenotype_transDMproB_versus_DMpreB.cls#transDMproB_versus_DMpreB_repos |
| Upregulated in class | transDMproB |
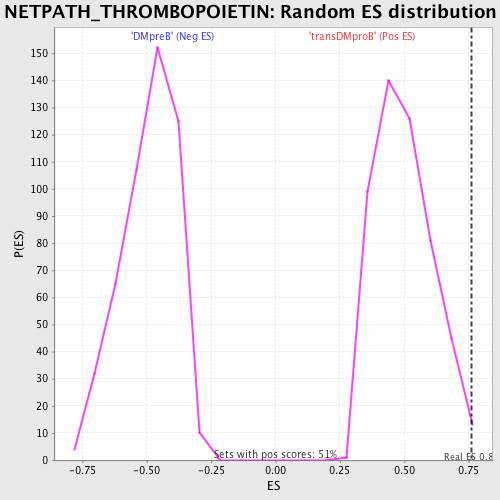
| GeneSet | NETPATH_THROMBOPOIETIN |
| Enrichment Score (ES) | 0.7629237 |
| Normalized Enrichment Score (NES) | 1.5278295 |
| Nominal p-value | 0.007920792 |
| FDR q-value | 0.20158863 |
| FWER p-Value | 0.906 |
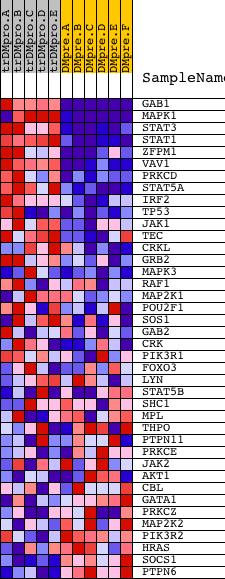
| PROBE | DESCRIPTION (from dataset) | GENE SYMBOL | GENE_TITLE | RANK IN GENE LIST | RANK METRIC SCORE | RUNNING ES | CORE ENRICHMENT | |
|---|---|---|---|---|---|---|---|---|
| 1 | GAB1 | 18828 | 64 | 3.185 | 0.1746 | Yes | ||
| 2 | MAPK1 | 1642 11167 | 108 | 2.667 | 0.3214 | Yes | ||
| 3 | STAT3 | 5525 9906 | 396 | 1.605 | 0.3957 | Yes | ||
| 4 | STAT1 | 3936 5524 | 531 | 1.404 | 0.4670 | Yes | ||
| 5 | ZFPM1 | 18439 | 716 | 1.092 | 0.5182 | Yes | ||
| 6 | VAV1 | 23173 | 746 | 1.053 | 0.5754 | Yes | ||
| 7 | PRKCD | 21897 | 1031 | 0.813 | 0.6056 | Yes | ||
| 8 | STAT5A | 20664 | 1207 | 0.676 | 0.6340 | Yes | ||
| 9 | IRF2 | 18621 | 1298 | 0.623 | 0.6640 | Yes | ||
| 10 | TP53 | 20822 | 1359 | 0.593 | 0.6939 | Yes | ||
| 11 | JAK1 | 15827 | 1468 | 0.543 | 0.7184 | Yes | ||
| 12 | TEC | 16514 | 1558 | 0.496 | 0.7414 | Yes | ||
| 13 | CRKL | 4560 | 1800 | 0.391 | 0.7503 | Yes | ||
| 14 | GRB2 | 20149 | 1927 | 0.347 | 0.7629 | Yes | ||
| 15 | MAPK3 | 6458 11170 | 2440 | 0.214 | 0.7473 | No | ||
| 16 | RAF1 | 17035 | 3038 | 0.101 | 0.7208 | No | ||
| 17 | MAP2K1 | 19082 | 3174 | 0.087 | 0.7185 | No | ||
| 18 | POU2F1 | 5275 3989 4065 4010 | 3779 | 0.043 | 0.6884 | No | ||
| 19 | SOS1 | 5476 | 4722 | 0.015 | 0.6385 | No | ||
| 20 | GAB2 | 1821 18184 2025 | 4849 | 0.013 | 0.6325 | No | ||
| 21 | CRK | 4559 1249 | 4892 | 0.013 | 0.6309 | No | ||
| 22 | PIK3R1 | 3170 | 4940 | 0.013 | 0.6291 | No | ||
| 23 | FOXO3 | 19782 3402 | 6843 | 0.003 | 0.5269 | No | ||
| 24 | LYN | 16281 | 7120 | 0.002 | 0.5121 | No | ||
| 25 | STAT5B | 20222 | 8729 | -0.002 | 0.4257 | No | ||
| 26 | SHC1 | 9813 9812 5430 | 9137 | -0.003 | 0.4039 | No | ||
| 27 | MPL | 15780 | 9154 | -0.003 | 0.4032 | No | ||
| 28 | THPO | 22636 | 9280 | -0.003 | 0.3967 | No | ||
| 29 | PTPN11 | 5326 16391 9660 | 9713 | -0.004 | 0.3736 | No | ||
| 30 | PRKCE | 9575 | 10001 | -0.005 | 0.3585 | No | ||
| 31 | JAK2 | 23893 9197 3706 | 11807 | -0.012 | 0.2619 | No | ||
| 32 | AKT1 | 8568 | 13176 | -0.023 | 0.1896 | No | ||
| 33 | CBL | 19154 | 13815 | -0.033 | 0.1571 | No | ||
| 34 | GATA1 | 24196 | 14422 | -0.047 | 0.1271 | No | ||
| 35 | PRKCZ | 5260 | 15276 | -0.095 | 0.0865 | No | ||
| 36 | MAP2K2 | 19933 | 15726 | -0.151 | 0.0708 | No | ||
| 37 | PIK3R2 | 18850 | 15900 | -0.181 | 0.0716 | No | ||
| 38 | HRAS | 4868 | 16569 | -0.329 | 0.0541 | No | ||
| 39 | SOCS1 | 4522 | 16690 | -0.364 | 0.0679 | No | ||
| 40 | PTPN6 | 17002 | 17395 | -0.639 | 0.0657 | No |