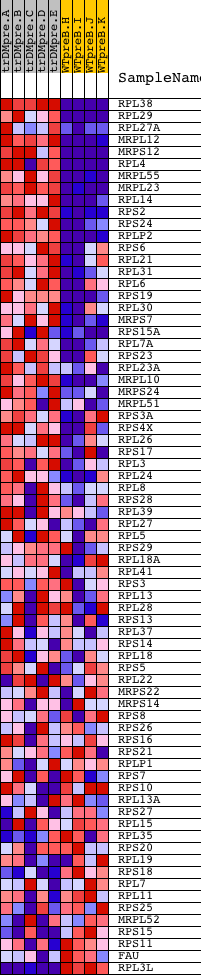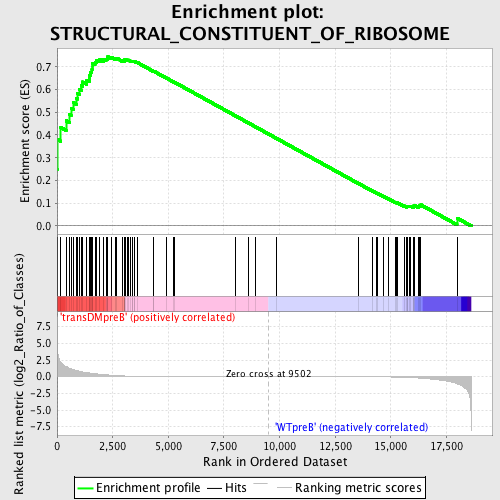
Profile of the Running ES Score & Positions of GeneSet Members on the Rank Ordered List
| Dataset | Set_04_transDMpreB_versus_WTpreB.phenotype_transDMpreB_versus_WTpreB.cls #transDMpreB_versus_WTpreB |
| Phenotype | phenotype_transDMpreB_versus_WTpreB.cls#transDMpreB_versus_WTpreB |
| Upregulated in class | transDMpreB |
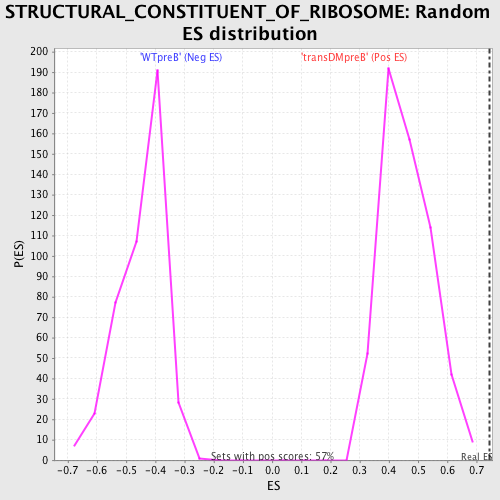
| GeneSet | STRUCTURAL_CONSTITUENT_OF_RIBOSOME |
| Enrichment Score (ES) | 0.7435 |
| Normalized Enrichment Score (NES) | 1.617241 |
| Nominal p-value | 0.0 |
| FDR q-value | 0.05606469 |
| FWER p-Value | 0.267 |
| PROBE | DESCRIPTION (from dataset) | GENE SYMBOL | GENE_TITLE | RANK IN GENE LIST | RANK METRIC SCORE | RUNNING ES | CORE ENRICHMENT | |
|---|---|---|---|---|---|---|---|---|
| 1 | RPL38 | 12562 20606 7475 | 0 | 8.861 | 0.2485 | Yes | ||
| 2 | RPL29 | 9741 | 9 | 4.712 | 0.3802 | Yes | ||
| 3 | RPL27A | 11181 6467 18130 | 165 | 2.198 | 0.4335 | Yes | ||
| 4 | MRPL12 | 12090 | 407 | 1.502 | 0.4626 | Yes | ||
| 5 | MRPS12 | 17907 6273 | 553 | 1.262 | 0.4902 | Yes | ||
| 6 | RPL4 | 7499 19411 | 632 | 1.162 | 0.5185 | Yes | ||
| 7 | MRPL55 | 20864 | 746 | 1.034 | 0.5415 | Yes | ||
| 8 | MRPL23 | 9738 | 877 | 0.912 | 0.5600 | Yes | ||
| 9 | RPL14 | 19267 | 917 | 0.881 | 0.5826 | Yes | ||
| 10 | RPS2 | 9279 | 1009 | 0.800 | 0.6002 | Yes | ||
| 11 | RPS24 | 5399 | 1091 | 0.739 | 0.6165 | Yes | ||
| 12 | RPLP2 | 7401 | 1150 | 0.703 | 0.6331 | Yes | ||
| 13 | RPS6 | 9757 | 1335 | 0.604 | 0.6401 | Yes | ||
| 14 | RPL21 | 9737 16624 5391 | 1458 | 0.544 | 0.6488 | Yes | ||
| 15 | RPL31 | 14267 | 1469 | 0.541 | 0.6634 | Yes | ||
| 16 | RPL6 | 9747 | 1509 | 0.525 | 0.6761 | Yes | ||
| 17 | RPS19 | 5398 | 1565 | 0.505 | 0.6872 | Yes | ||
| 18 | RPL30 | 9742 | 1576 | 0.501 | 0.7007 | Yes | ||
| 19 | MRPS7 | 20595 | 1580 | 0.499 | 0.7146 | Yes | ||
| 20 | RPS15A | 6476 | 1706 | 0.453 | 0.7205 | Yes | ||
| 21 | RPL7A | 11312 | 1780 | 0.427 | 0.7286 | Yes | ||
| 22 | RPS23 | 12352 | 1919 | 0.370 | 0.7315 | Yes | ||
| 23 | RPL23A | 11193 | 2088 | 0.316 | 0.7313 | Yes | ||
| 24 | MRPL10 | 20681 | 2200 | 0.280 | 0.7332 | Yes | ||
| 25 | MRPS24 | 12262 | 2255 | 0.265 | 0.7377 | Yes | ||
| 26 | MRPL51 | 12361 7301 | 2282 | 0.257 | 0.7435 | Yes | ||
| 27 | RPS3A | 9755 | 2442 | 0.215 | 0.7410 | No | ||
| 28 | RPS4X | 9756 | 2634 | 0.168 | 0.7354 | No | ||
| 29 | RPL26 | 9739 | 2669 | 0.162 | 0.7381 | No | ||
| 30 | RPS17 | 9753 | 2933 | 0.117 | 0.7272 | No | ||
| 31 | RPL3 | 11330 | 3017 | 0.105 | 0.7257 | No | ||
| 32 | RPL24 | 12664 | 3030 | 0.103 | 0.7279 | No | ||
| 33 | RPL8 | 22437 | 3042 | 0.101 | 0.7301 | No | ||
| 34 | RPS28 | 12009 | 3063 | 0.098 | 0.7318 | No | ||
| 35 | RPL39 | 12496 | 3151 | 0.088 | 0.7296 | No | ||
| 36 | RPL27 | 9740 | 3193 | 0.083 | 0.7297 | No | ||
| 37 | RPL5 | 9746 | 3313 | 0.073 | 0.7253 | No | ||
| 38 | RPS29 | 9754 | 3372 | 0.069 | 0.7241 | No | ||
| 39 | RPL18A | 13358 | 3402 | 0.066 | 0.7244 | No | ||
| 40 | RPL41 | 12611 | 3459 | 0.062 | 0.7231 | No | ||
| 41 | RPS3 | 6549 11295 | 3474 | 0.061 | 0.7241 | No | ||
| 42 | RPL13 | 11284 | 3615 | 0.053 | 0.7180 | No | ||
| 43 | RPL28 | 5392 | 4339 | 0.029 | 0.6798 | No | ||
| 44 | RPS13 | 12633 | 4353 | 0.029 | 0.6799 | No | ||
| 45 | RPL37 | 12502 7421 22521 | 4926 | 0.020 | 0.6496 | No | ||
| 46 | RPS14 | 9751 | 5243 | 0.016 | 0.6331 | No | ||
| 47 | RPL18 | 450 5390 | 5260 | 0.016 | 0.6326 | No | ||
| 48 | RPS5 | 18391 | 8030 | 0.004 | 0.4834 | No | ||
| 49 | RPL22 | 15979 | 8609 | 0.002 | 0.4523 | No | ||
| 50 | MRPS22 | 19031 | 8918 | 0.001 | 0.4358 | No | ||
| 51 | MRPS14 | 14083 | 9851 | -0.001 | 0.3855 | No | ||
| 52 | RPS8 | 9761 | 13563 | -0.016 | 0.1859 | No | ||
| 53 | RPS26 | 11331 | 14176 | -0.025 | 0.1535 | No | ||
| 54 | RPS16 | 9752 | 14362 | -0.028 | 0.1443 | No | ||
| 55 | RPS21 | 12356 | 14399 | -0.028 | 0.1432 | No | ||
| 56 | RPLP1 | 3010 | 14673 | -0.036 | 0.1295 | No | ||
| 57 | RPS7 | 9760 | 14888 | -0.043 | 0.1191 | No | ||
| 58 | RPS10 | 12464 | 15187 | -0.055 | 0.1046 | No | ||
| 59 | RPL13A | 10226 79 | 15259 | -0.059 | 0.1024 | No | ||
| 60 | RPS27 | 12183 | 15287 | -0.061 | 0.1027 | No | ||
| 61 | RPL15 | 12355 | 15606 | -0.087 | 0.0880 | No | ||
| 62 | RPL35 | 12360 | 15718 | -0.097 | 0.0847 | No | ||
| 63 | RPS20 | 7438 | 15729 | -0.098 | 0.0869 | No | ||
| 64 | RPL19 | 9736 | 15770 | -0.103 | 0.0877 | No | ||
| 65 | RPS18 | 1529 5397 1603 | 15825 | -0.109 | 0.0878 | No | ||
| 66 | RPL7 | 9748 | 15898 | -0.119 | 0.0873 | No | ||
| 67 | RPL11 | 12450 | 16025 | -0.143 | 0.0845 | No | ||
| 68 | RPS25 | 13270 | 16038 | -0.145 | 0.0879 | No | ||
| 69 | MRPL52 | 22019 | 16065 | -0.152 | 0.0908 | No | ||
| 70 | RPS15 | 5396 | 16258 | -0.197 | 0.0860 | No | ||
| 71 | RPS11 | 11317 | 16274 | -0.200 | 0.0908 | No | ||
| 72 | FAU | 8954 | 16354 | -0.219 | 0.0926 | No | ||
| 73 | RPL3L | 23354 | 17976 | -1.044 | 0.0345 | No |