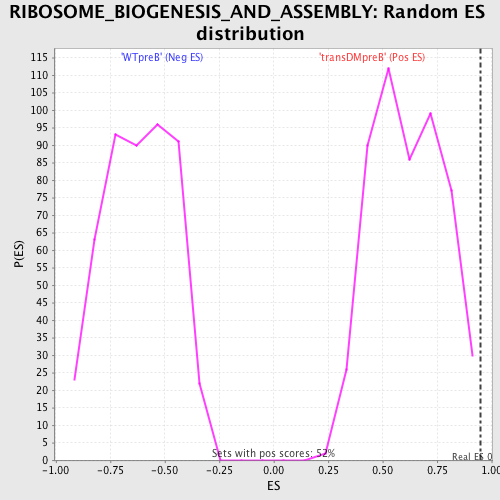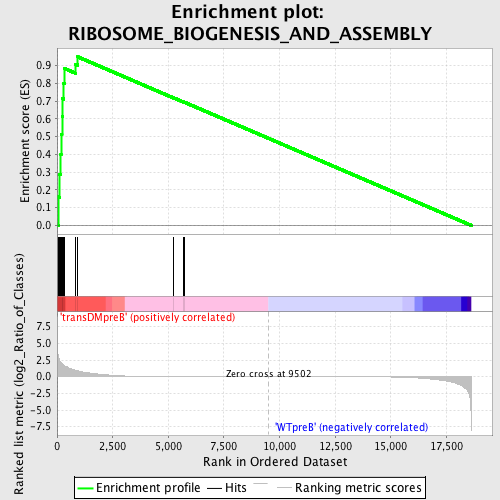
Profile of the Running ES Score & Positions of GeneSet Members on the Rank Ordered List
| Dataset | Set_04_transDMpreB_versus_WTpreB.phenotype_transDMpreB_versus_WTpreB.cls #transDMpreB_versus_WTpreB |
| Phenotype | phenotype_transDMpreB_versus_WTpreB.cls#transDMpreB_versus_WTpreB |
| Upregulated in class | transDMpreB |
| GeneSet | RIBOSOME_BIOGENESIS_AND_ASSEMBLY |
| Enrichment Score (ES) | 0.9483963 |
| Normalized Enrichment Score (NES) | 1.5389427 |
| Nominal p-value | 0.0038314175 |
| FDR q-value | 0.121975 |
| FWER p-Value | 0.876 |
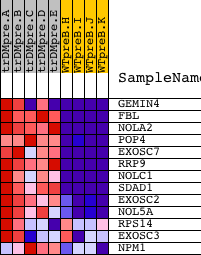
| PROBE | DESCRIPTION (from dataset) | GENE SYMBOL | GENE_TITLE | RANK IN GENE LIST | RANK METRIC SCORE | RUNNING ES | CORE ENRICHMENT | |
|---|---|---|---|---|---|---|---|---|
| 1 | GEMIN4 | 6592 6591 | 56 | 3.063 | 0.1610 | Yes | ||
| 2 | FBL | 8955 | 112 | 2.442 | 0.2888 | Yes | ||
| 3 | NOLA2 | 11972 | 168 | 2.153 | 0.4011 | Yes | ||
| 4 | POP4 | 7261 | 181 | 2.093 | 0.5125 | Yes | ||
| 5 | EXOSC7 | 19256 | 220 | 1.941 | 0.6144 | Yes | ||
| 6 | RRP9 | 19328 | 237 | 1.865 | 0.7134 | Yes | ||
| 7 | NOLC1 | 7704 | 300 | 1.658 | 0.7989 | Yes | ||
| 8 | SDAD1 | 16479 | 333 | 1.600 | 0.8828 | Yes | ||
| 9 | EXOSC2 | 15044 | 836 | 0.949 | 0.9066 | Yes | ||
| 10 | NOL5A | 12474 | 928 | 0.871 | 0.9484 | Yes | ||
| 11 | RPS14 | 9751 | 5243 | 0.016 | 0.7174 | No | ||
| 12 | EXOSC3 | 15890 | 5702 | 0.012 | 0.6934 | No | ||
| 13 | NPM1 | 1196 | 5715 | 0.012 | 0.6935 | No |