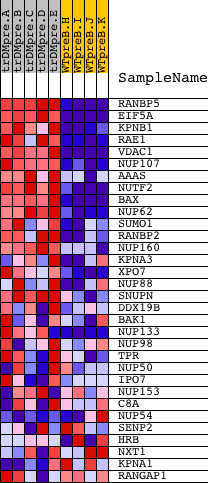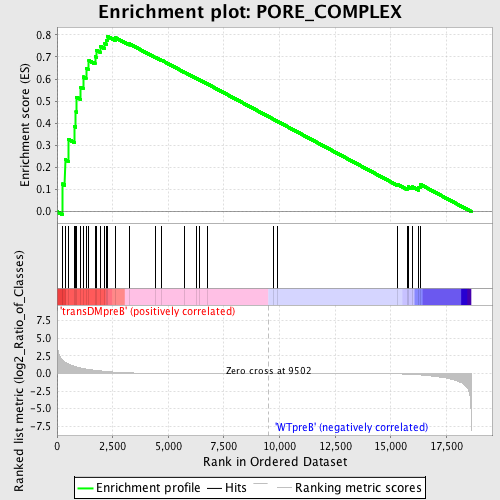
Profile of the Running ES Score & Positions of GeneSet Members on the Rank Ordered List
| Dataset | Set_04_transDMpreB_versus_WTpreB.phenotype_transDMpreB_versus_WTpreB.cls #transDMpreB_versus_WTpreB |
| Phenotype | phenotype_transDMpreB_versus_WTpreB.cls#transDMpreB_versus_WTpreB |
| Upregulated in class | transDMpreB |
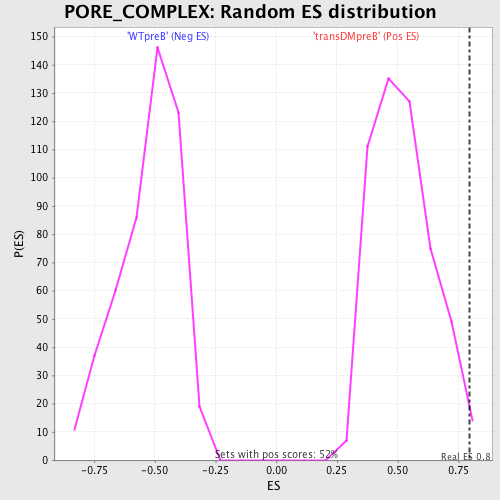
| GeneSet | PORE_COMPLEX |
| Enrichment Score (ES) | 0.7944849 |
| Normalized Enrichment Score (NES) | 1.5262868 |
| Nominal p-value | 0.011583012 |
| FDR q-value | 0.1401345 |
| FWER p-Value | 0.937 |
| PROBE | DESCRIPTION (from dataset) | GENE SYMBOL | GENE_TITLE | RANK IN GENE LIST | RANK METRIC SCORE | RUNNING ES | CORE ENRICHMENT | |
|---|---|---|---|---|---|---|---|---|
| 1 | RANBP5 | 21930 | 239 | 1.861 | 0.1253 | Yes | ||
| 2 | EIF5A | 11345 20379 6590 | 354 | 1.574 | 0.2361 | Yes | ||
| 3 | KPNB1 | 20274 | 510 | 1.331 | 0.3267 | Yes | ||
| 4 | RAE1 | 12395 | 793 | 0.987 | 0.3848 | Yes | ||
| 5 | VDAC1 | 10282 | 847 | 0.935 | 0.4513 | Yes | ||
| 6 | NUP107 | 8337 | 872 | 0.916 | 0.5181 | Yes | ||
| 7 | AAAS | 22111 2274 | 1064 | 0.758 | 0.5641 | Yes | ||
| 8 | NUTF2 | 12632 7529 | 1171 | 0.691 | 0.6097 | Yes | ||
| 9 | BAX | 17832 | 1302 | 0.620 | 0.6487 | Yes | ||
| 10 | NUP62 | 9497 | 1427 | 0.558 | 0.6835 | Yes | ||
| 11 | SUMO1 | 5826 3943 10247 | 1708 | 0.452 | 0.7020 | Yes | ||
| 12 | RANBP2 | 20019 | 1763 | 0.431 | 0.7311 | Yes | ||
| 13 | NUP160 | 14957 | 1935 | 0.365 | 0.7490 | Yes | ||
| 14 | KPNA3 | 21797 | 2144 | 0.299 | 0.7600 | Yes | ||
| 15 | XPO7 | 12272 7239 | 2214 | 0.277 | 0.7769 | Yes | ||
| 16 | NUP88 | 20365 1316 | 2254 | 0.265 | 0.7945 | Yes | ||
| 17 | SNUPN | 12282 | 2616 | 0.171 | 0.7877 | No | ||
| 18 | DDX19B | 8888 | 3240 | 0.079 | 0.7600 | No | ||
| 19 | BAK1 | 23058 | 4404 | 0.027 | 0.6995 | No | ||
| 20 | NUP133 | 3849 18714 | 4702 | 0.023 | 0.6852 | No | ||
| 21 | NUP98 | 17726 | 5728 | 0.012 | 0.6310 | No | ||
| 22 | TPR | 927 4255 | 6249 | 0.010 | 0.6037 | No | ||
| 23 | NUP50 | 22403 9478 22402 2168 | 6401 | 0.009 | 0.5962 | No | ||
| 24 | IPO7 | 6130 | 6752 | 0.008 | 0.5780 | No | ||
| 25 | NUP153 | 21474 | 9747 | -0.001 | 0.4169 | No | ||
| 26 | C8A | 15823 | 9923 | -0.001 | 0.4076 | No | ||
| 27 | NUP54 | 11231 11232 6516 | 15306 | -0.062 | 0.1226 | No | ||
| 28 | SENP2 | 7990 | 15735 | -0.100 | 0.1070 | No | ||
| 29 | HRB | 14208 4066 | 15780 | -0.105 | 0.1124 | No | ||
| 30 | NXT1 | 14814 | 15956 | -0.132 | 0.1128 | No | ||
| 31 | KPNA1 | 22776 | 16251 | -0.195 | 0.1115 | No | ||
| 32 | RANGAP1 | 2180 22195 | 16328 | -0.212 | 0.1231 | No |