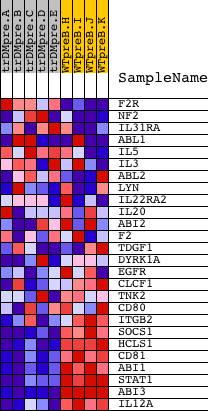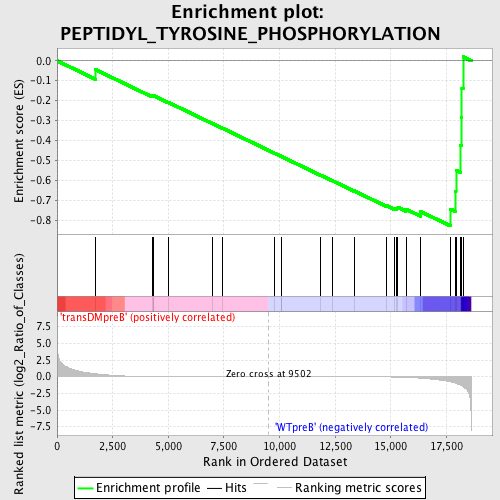
Profile of the Running ES Score & Positions of GeneSet Members on the Rank Ordered List
| Dataset | Set_04_transDMpreB_versus_WTpreB.phenotype_transDMpreB_versus_WTpreB.cls #transDMpreB_versus_WTpreB |
| Phenotype | phenotype_transDMpreB_versus_WTpreB.cls#transDMpreB_versus_WTpreB |
| Upregulated in class | WTpreB |
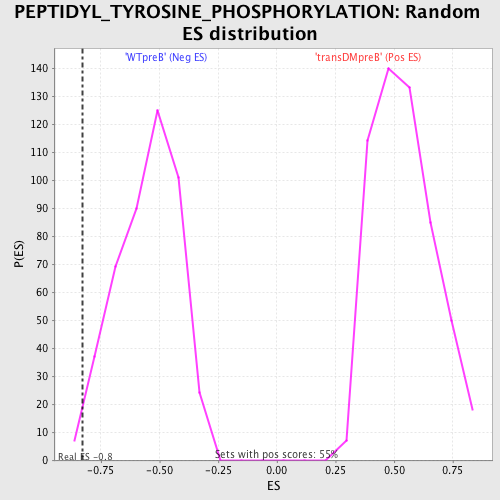
| GeneSet | PEPTIDYL_TYROSINE_PHOSPHORYLATION |
| Enrichment Score (ES) | -0.8284168 |
| Normalized Enrichment Score (NES) | -1.5067424 |
| Nominal p-value | 0.015452539 |
| FDR q-value | 0.3969297 |
| FWER p-Value | 0.989 |
| PROBE | DESCRIPTION (from dataset) | GENE SYMBOL | GENE_TITLE | RANK IN GENE LIST | RANK METRIC SCORE | RUNNING ES | CORE ENRICHMENT | |
|---|---|---|---|---|---|---|---|---|
| 1 | F2R | 21386 | 1716 | 0.449 | -0.0438 | No | ||
| 2 | NF2 | 1222 5166 | 4275 | 0.030 | -0.1781 | No | ||
| 3 | IL31RA | 21347 | 4314 | 0.029 | -0.1770 | No | ||
| 4 | ABL1 | 2693 4301 2794 | 4331 | 0.029 | -0.1747 | No | ||
| 5 | IL5 | 20884 10220 | 5018 | 0.019 | -0.2096 | No | ||
| 6 | IL3 | 20453 | 6996 | 0.007 | -0.3152 | No | ||
| 7 | ABL2 | 8509 | 7445 | 0.005 | -0.3387 | No | ||
| 8 | LYN | 16281 | 9749 | -0.001 | -0.4625 | No | ||
| 9 | IL22RA2 | 20082 | 10071 | -0.001 | -0.4796 | No | ||
| 10 | IL20 | 13840 | 10096 | -0.002 | -0.4808 | No | ||
| 11 | ABI2 | 4037 6830 | 11849 | -0.006 | -0.5743 | No | ||
| 12 | F2 | 14524 | 12380 | -0.009 | -0.6019 | No | ||
| 13 | TDGF1 | 5704 10108 | 13351 | -0.014 | -0.6525 | No | ||
| 14 | DYRK1A | 4649 | 14792 | -0.039 | -0.7258 | No | ||
| 15 | EGFR | 1329 20944 | 15177 | -0.055 | -0.7405 | No | ||
| 16 | CLCF1 | 12160 3742 | 15257 | -0.059 | -0.7383 | No | ||
| 17 | TNK2 | 22784 | 15319 | -0.063 | -0.7349 | No | ||
| 18 | CD80 | 22758 | 15683 | -0.094 | -0.7443 | No | ||
| 19 | ITGB2 | 19978 | 16347 | -0.217 | -0.7566 | Yes | ||
| 20 | SOCS1 | 4522 | 17684 | -0.779 | -0.7444 | Yes | ||
| 21 | HCLS1 | 22770 | 17891 | -0.942 | -0.6538 | Yes | ||
| 22 | CD81 | 8719 | 17930 | -0.995 | -0.5485 | Yes | ||
| 23 | ABI1 | 4300 | 18144 | -1.265 | -0.4234 | Yes | ||
| 24 | STAT1 | 3936 5524 | 18185 | -1.330 | -0.2819 | Yes | ||
| 25 | ABI3 | 7314 | 18195 | -1.347 | -0.1371 | Yes | ||
| 26 | IL12A | 4913 | 18250 | -1.479 | 0.0197 | Yes |