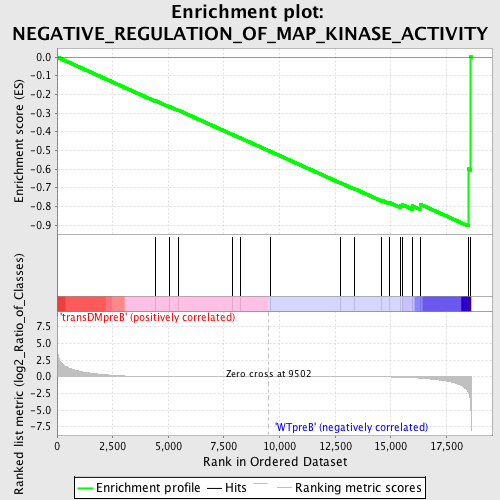
Profile of the Running ES Score & Positions of GeneSet Members on the Rank Ordered List
| Dataset | Set_04_transDMpreB_versus_WTpreB.phenotype_transDMpreB_versus_WTpreB.cls #transDMpreB_versus_WTpreB |
| Phenotype | phenotype_transDMpreB_versus_WTpreB.cls#transDMpreB_versus_WTpreB |
| Upregulated in class | WTpreB |
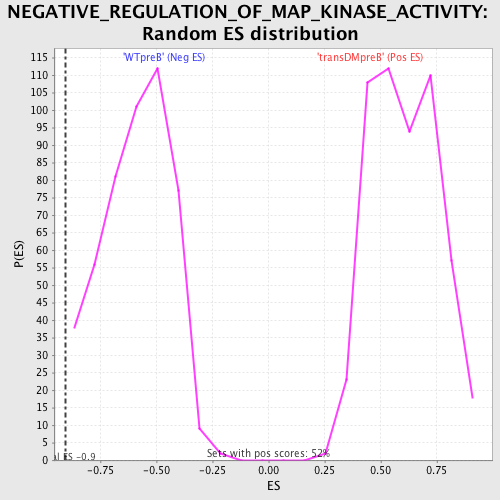
| GeneSet | NEGATIVE_REGULATION_OF_MAP_KINASE_ACTIVITY |
| Enrichment Score (ES) | -0.9051234 |
| Normalized Enrichment Score (NES) | -1.5376298 |
| Nominal p-value | 0.004201681 |
| FDR q-value | 0.32664928 |
| FWER p-Value | 0.924 |
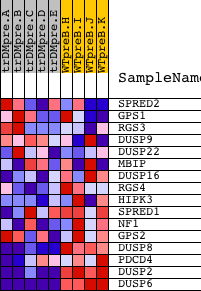
| PROBE | DESCRIPTION (from dataset) | GENE SYMBOL | GENE_TITLE | RANK IN GENE LIST | RANK METRIC SCORE | RUNNING ES | CORE ENRICHMENT | |
|---|---|---|---|---|---|---|---|---|
| 1 | SPRED2 | 8539 4332 | 4436 | 0.027 | -0.2349 | No | ||
| 2 | GPS1 | 1392 9943 5550 9944 | 5073 | 0.018 | -0.2667 | No | ||
| 3 | RGS3 | 2434 2474 6937 11935 2374 2332 2445 2390 | 5449 | 0.015 | -0.2850 | No | ||
| 4 | DUSP9 | 24307 | 7864 | 0.004 | -0.4142 | No | ||
| 5 | DUSP22 | 466 21680 | 8257 | 0.003 | -0.4348 | No | ||
| 6 | MBIP | 21063 2072 | 9602 | -0.000 | -0.5071 | No | ||
| 7 | DUSP16 | 1004 7699 | 12737 | -0.010 | -0.6742 | No | ||
| 8 | RGS4 | 9724 | 13352 | -0.014 | -0.7053 | No | ||
| 9 | HIPK3 | 14504 | 14596 | -0.033 | -0.7677 | No | ||
| 10 | SPRED1 | 4331 | 14919 | -0.044 | -0.7792 | No | ||
| 11 | NF1 | 5165 | 15418 | -0.071 | -0.7966 | No | ||
| 12 | GPS2 | 12096 | 15516 | -0.080 | -0.7913 | No | ||
| 13 | DUSP8 | 9493 | 15966 | -0.134 | -0.7976 | Yes | ||
| 14 | PDCD4 | 5232 23816 | 16313 | -0.209 | -0.7885 | Yes | ||
| 15 | DUSP2 | 14865 | 18483 | -2.302 | -0.5996 | Yes | ||
| 16 | DUSP6 | 19891 3399 | 18597 | -4.571 | 0.0010 | Yes |